Sports & Outdoor

Sports & Outdoor: Performance Marketing for Active Lifestyle Brands
The sports and outdoor category represents a $120+ billion market opportunity, driven by consumers investing in fitness, outdoor recreation, and active lifestyles. From yoga mats and resistance bands to camping gear and cycling accessories, this category blends functional performance requirements with aspirational lifestyle branding. Amazon's sports category alone generates $10+ billion annually, while specialty retailers maintain strong brand partnerships for premium positioning.
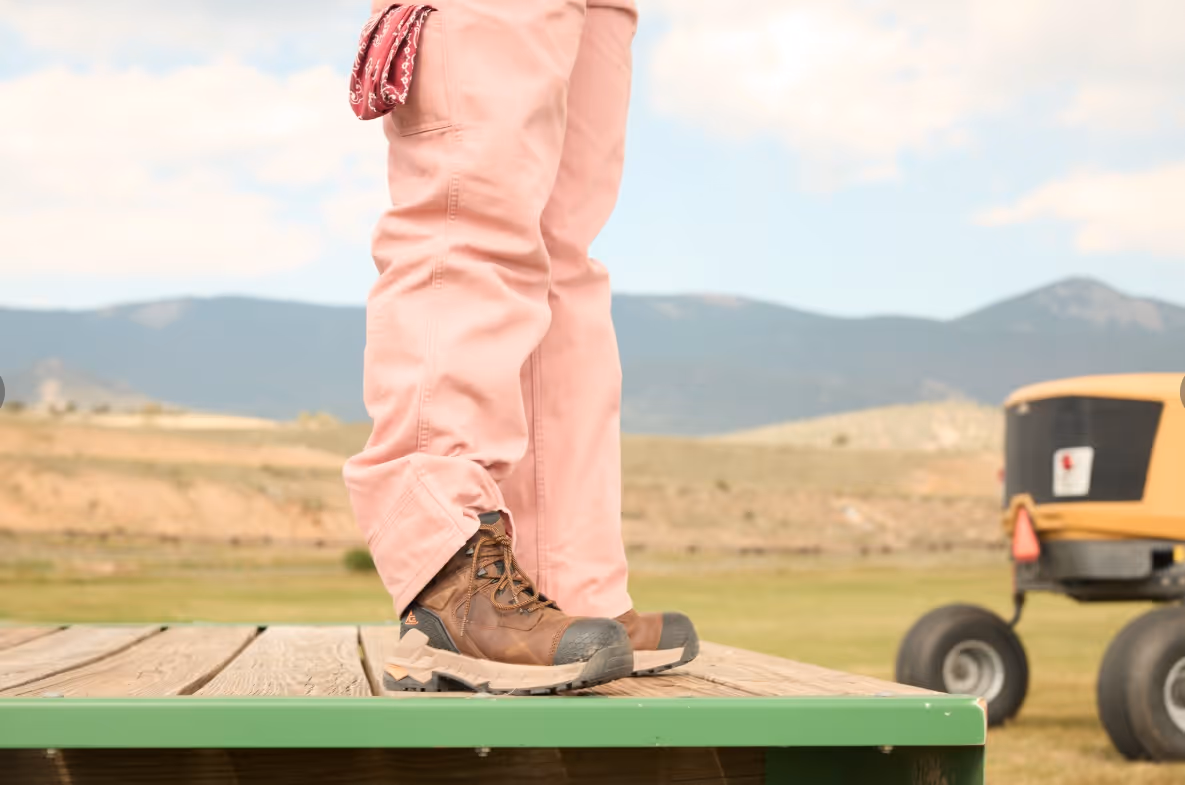
Our sports and outdoor expertise spans athletic equipment (home gym, resistance training, cardio equipment), outdoor gear (camping, hiking, fishing, hunting), team sports equipment (baseball, basketball, soccer, football), fitness accessories (yoga, pilates, foam rolling, recovery), cycling and running gear, and water sports and swimming products. We understand seasonal buying patterns, with major spikes during New Year's resolution season and summer outdoor recreation periods.
Whether you're launching fitness equipment on Amazon with aggressive advertising strategies, expanding outdoor gear through Walmart for broader distribution, or building community-driven DTC channels via Shopify, our team delivers the category expertise and performance marketing skills to capture active lifestyle consumers across all channels.
Sports & Outdoor Services
FAQ
4–8 weeks before the category demand peak. For summer outdoor (fitness gear, outdoor recreation, grilling, etc.), start ad pressure in early April to ride the April–June ramp. Seasonal search volume typically begins climbing 10–12 weeks before peak, with initial awareness spend building keyword rankings and review velocity. Starting at peak means competing against brands that already rank. For specific sports with shorter seasons (skiing, golf launch, cycling spring ramp), the window is tighter, 4–6 weeks before category activity begins.
For apparel with high-confidence sizing and quality, yes. It reduces sizing-anxiety conversion barriers. For athletic apparel specifically, Prime Try Before You Buy (formerly Prime Wardrobe) drives 15–25% higher conversion on SKUs enrolled, mostly among buyers who don't know your brand. Trade-off: return rate increases because shoppers order multiple sizes knowing they can return some. Net unit economics are usually positive for brands with per-unit margin above 40%. Below that, the return processing cost can erase the conversion lift. Test on a few SKUs before enrolling the full catalog.
Size charts with measured specs (not just S/M/L), side-by-side fit comparisons to common category benchmarks (Nike, Adidas), and clear fit callouts in A+ Content ("runs 1/2 size small, order up"). Most athletic footwear return rates run 25–40% with size as the #1 reason. Brands that get return rates under 20% explicitly address sizing uncertainty: visible fit guide links, narrow vs wide callouts, and aggressive use of customer Q&A responses to address specific sizing questions. The fix is informational, not product-redesign.
Depends on your specialty retail partners and the brand's growth stage. Brands with 5+ years of specialty retail DNA (REI, Backcountry, specialty bike shops) often find Amazon creates margin pressure that specialty retailers use against them during negotiations. Newer brands without strong specialty retail accounts generally benefit from Amazon for discovery and volume. The middle path we see work: Amazon for entry-SKU or category-general products, specialty retail exclusive for premium/technical SKUs. Brands that try to put everything on Amazon and still maintain full specialty retail relationships usually see friction from one side.
Athletic apparel: 15–30% returns, with sizing as 60–75% of the reason. Athletic hard goods (backpacks, water bottles, yoga mats, fitness equipment): 5–12% returns, mostly product-fit or damage issues. Footwear: 20–40% returns. Accessories (socks, wristbands, hats): under 8% returns. These compare to category-wide Amazon benchmarks: apparel 20–30%, hard goods 4–8%. Athletic specifically runs slightly higher than general apparel because of performance-fit expectations. If your numbers are above these ranges, the issue is usually listing information (sizing specs, fit expectations) rather than product quality.