$
43.2
K
X
%
Ad-attributed sales growth — Prime Day 25 vs 26

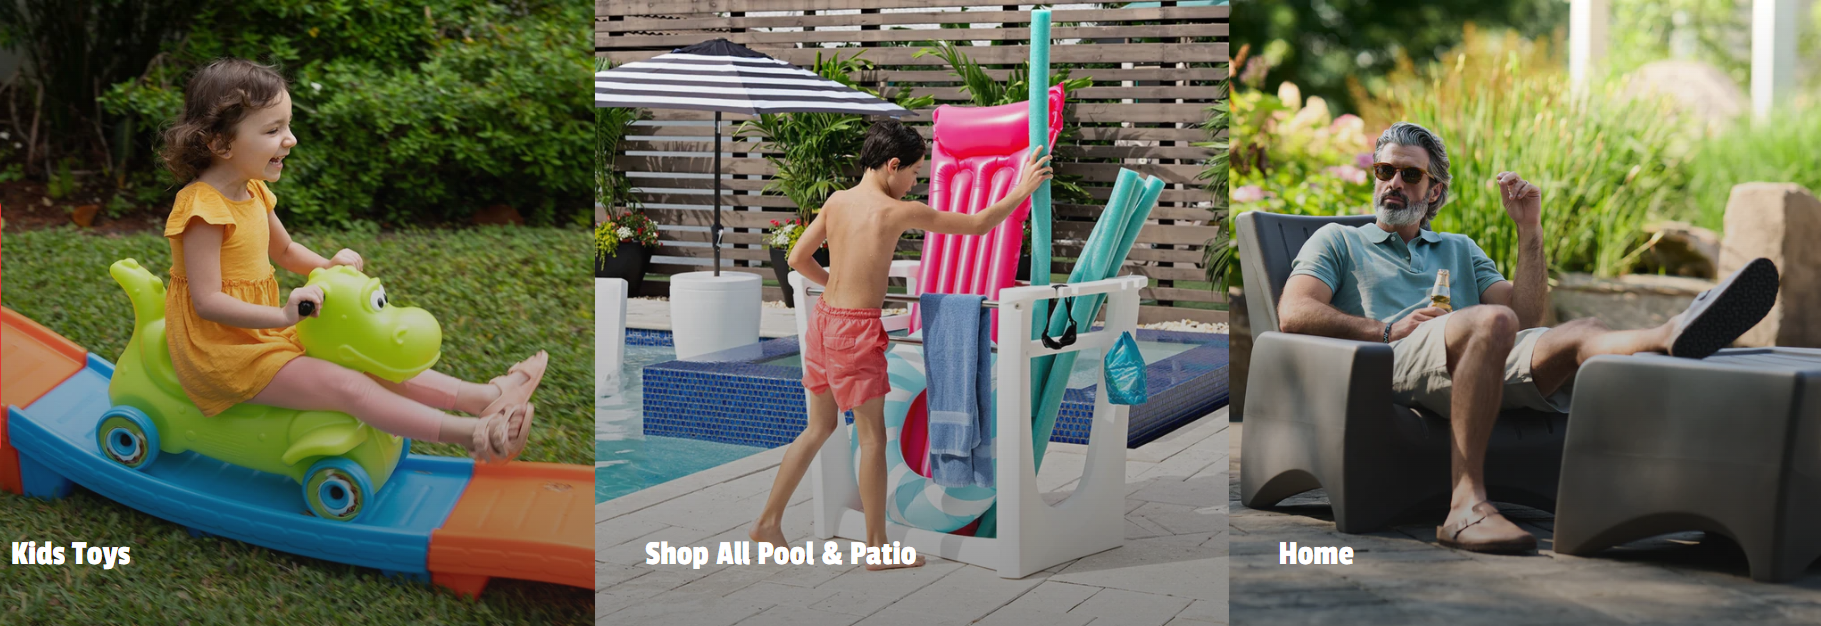
Step 2 started 2026 slow. Q1 and Q2 both came in unable to eclipse prior-year revenue, and the causes were structural: product prices had increased, organic visibility had reduced, and it now took more spend to capture the same revenue the account produced a year earlier.
That left Prime Day carrying more weight than a single four-day event should have to. Nectar's ads team also planned it blind. The prior year's Prime Day had been managed elsewhere, so there was no campaign-level history to build the 2026 strategy from. Four days to break a two-quarter trend, with limited visibility into what had worked the year before.
Increased competition made it harder for Step 2 to keep scaling efficiently. Competitors came in with lower pricing and were far more competitive in specific toy categories, and in pool especially, where their products were better positioned than in previous years. At the same time, Step 2's own prices had risen and organic visibility had fallen, which pushed more of the revenue burden onto paid in a period when paid was already working harder for the same return.
Success definition: beat the prior year's Prime Day on a stalled account without buying the growth.
The obvious play was more spend. Prime Day rewards aggression, the account was underperforming, and a budget increase is the easiest thing to sell into a flat year. Nectar went the other way. With no historical Prime Day ad data to model against, adding spend meant adding it blind, so the team treated the four days as a precision problem instead of a volume one. Hold spend roughly flat, and win on targeting quality, deal selection, and hour-by-hour budget control.
First, the team pulled spend out of auto-targeting and rebuilt around intentional keyword strategies — relevance over reach, across Sponsored Products, Sponsored Brands, Sponsored Brands Video, Sponsored Display, and DSP.
Second, deal and coupon selection was matched to the strongest SKUs rather than spread across the catalog, so promotional weight sat behind the ASINs most likely to convert under peak traffic.
Third, and this is where the event was won, budgets were managed to last all four days, not just the first surge. Competitors went dark as their budgets exhausted through the afternoon. Step 2 stayed live, and the largest revenue lifts landed after 4 PM each day, in auctions competitors had already left.
Straight event-over-event comparison: Prime Day 2025 against Prime Day 2026 (June 23–26), same account, same marketplace. The incrementality check is the spend line; ad-attributed revenue grew 43.2% while spend moved 6.3%, so the lift came from allocation, not budget. Total sales growth of 13.6% against a flat H1 confirms the event outperformed the account's underlying trend.
"Step 2 consolidated their deals and provided a strong discount offering, which allowed us to leverage their popularity during the peak summer Prime Day event. I'm very excited with the results; surpassing the previous year's revenue with less spend is no easy feat." — Tom Horak, Advertising Manager
Total Sales: +13.6%
Ad-Attributed Sales +43.2%
Ad Spend +6.3%
Ad-attributed revenue grew nearly seven times faster than the spend behind it, and ads carried a materially larger share of the event than the year before. In a year where Q1 and Q2 came in flat, Prime Day was the period that broke the trend, which makes the result a statement about execution, not about market conditions. This was Step 2's best Prime Day to date.
Peak events are usually lost in the last six hours, not the first. When budgets exhaust mid-afternoon, the brands still funded own the back half of the day against thinner competition, which means budget pacing and keyword discipline are worth more than incremental spend in most catalogs. If your account is flat, Prime Day is where disciplined allocation shows up as growth that the rest of the year cannot produce.