14 best ecommerce KPIs: examples to track growth
.png)

TL;DR:
Tracking only five core ecommerce KPIs helps brands make faster, clearer decisions aligned with specific business goals.
Focusing on outcome metrics like LTV, CAC, and Gross Margin ensures actions improve profitability and retention, not just activity.
Tracking ecommerce performance without the right KPIs is like navigating a city with a map of the wrong country. You’re moving, but not toward your goal. Focusing on 5 core metrics rather than 20 produces sharper decisions and faster action, yet most mid-market brands keep adding metrics to their dashboards without ever removing any. For Amazon, Walmart, and Shopify operators managing thousands of SKUs and millions in ad spend, that habit is expensive. This guide walks you through the 14 most impactful ecommerce KPIs, with real examples, a side-by-side comparison table, and a framework for deciding which ones deserve your attention this quarter.
Key Takeaways
| Point | Details |
|---|---|
| Focus on key metrics | Tracking 5 to 7 well-chosen KPIs leads to better decisions and faster growth. |
| Match KPIs to goals | Align each KPI to a specific business outcome, platform, or team function for maximum clarity. |
| Beware of top pitfalls | Avoid tracking vanity metrics, missing channel-specific nuances, or overloading dashboards. |
| Use actionable benchmarks | Apply relevant industry standards and adjust by product category for deeper insights. |
| Leverage expert tools | Partnering with advanced platforms streamlines KPI tracking and interpretation for marketplace success. |
How to choose the ecommerce KPIs that drive results
With the challenge of KPI overload in mind, let’s break down how to select only those metrics that will move the needle for your unique operation.
Not all KPIs are equal, and not all of them belong on your weekly review call. Before adding any metric to your dashboard, you need to classify it by type and purpose. Revenue-focused KPIs like Conversion Rate (CR) and Average Order Value (AOV) tell you whether you are growing the top line. Cost-focused KPIs like Customer Acquisition Cost (CAC) and Advertising Cost of Sales (ACOS) protect your margin. Retention-focused KPIs like Customer Lifetime Value (LTV) and Repeat Purchase Rate reveal whether your brand is building real asset value or just renting customers from platforms.
Your business stage also matters. A brand launching a new product category on Walmart needs to prioritize CR and ACOS above all else. A mature Shopify business with a loyal base should obsess over LTV and Gross Margin. Skipping this stage-based filter is one of the most common mistakes growing teams make.
Key criteria for selecting the right KPIs:
-
Does this metric connect directly to a decision you make every week?
-
Can your team take a clear action when this number moves up or down?
-
Is this metric specific to your channel, product category, and business model?
-
Does tracking it require less than 2 hours of data prep per reporting cycle?
-
Are you avoiding vanity metrics like page views or raw social impressions?
The most dangerous trap is confusing activity metrics with outcome metrics. Sessions are activity. Common ecommerce KPIs such as CR, AOV, LTV, CAC, Cart Abandonment Rate (CAR), Return Rate, ROAS, Gross Margin, Net Margin, Repeat Purchase Rate, Inventory Turnover, and marketplace-specific metrics like ACOS, ODR (Order Defect Rate), and OTDR (On-Time Delivery Rate) are outcomes. The distinction matters because outcomes are what your P&L actually reflects.
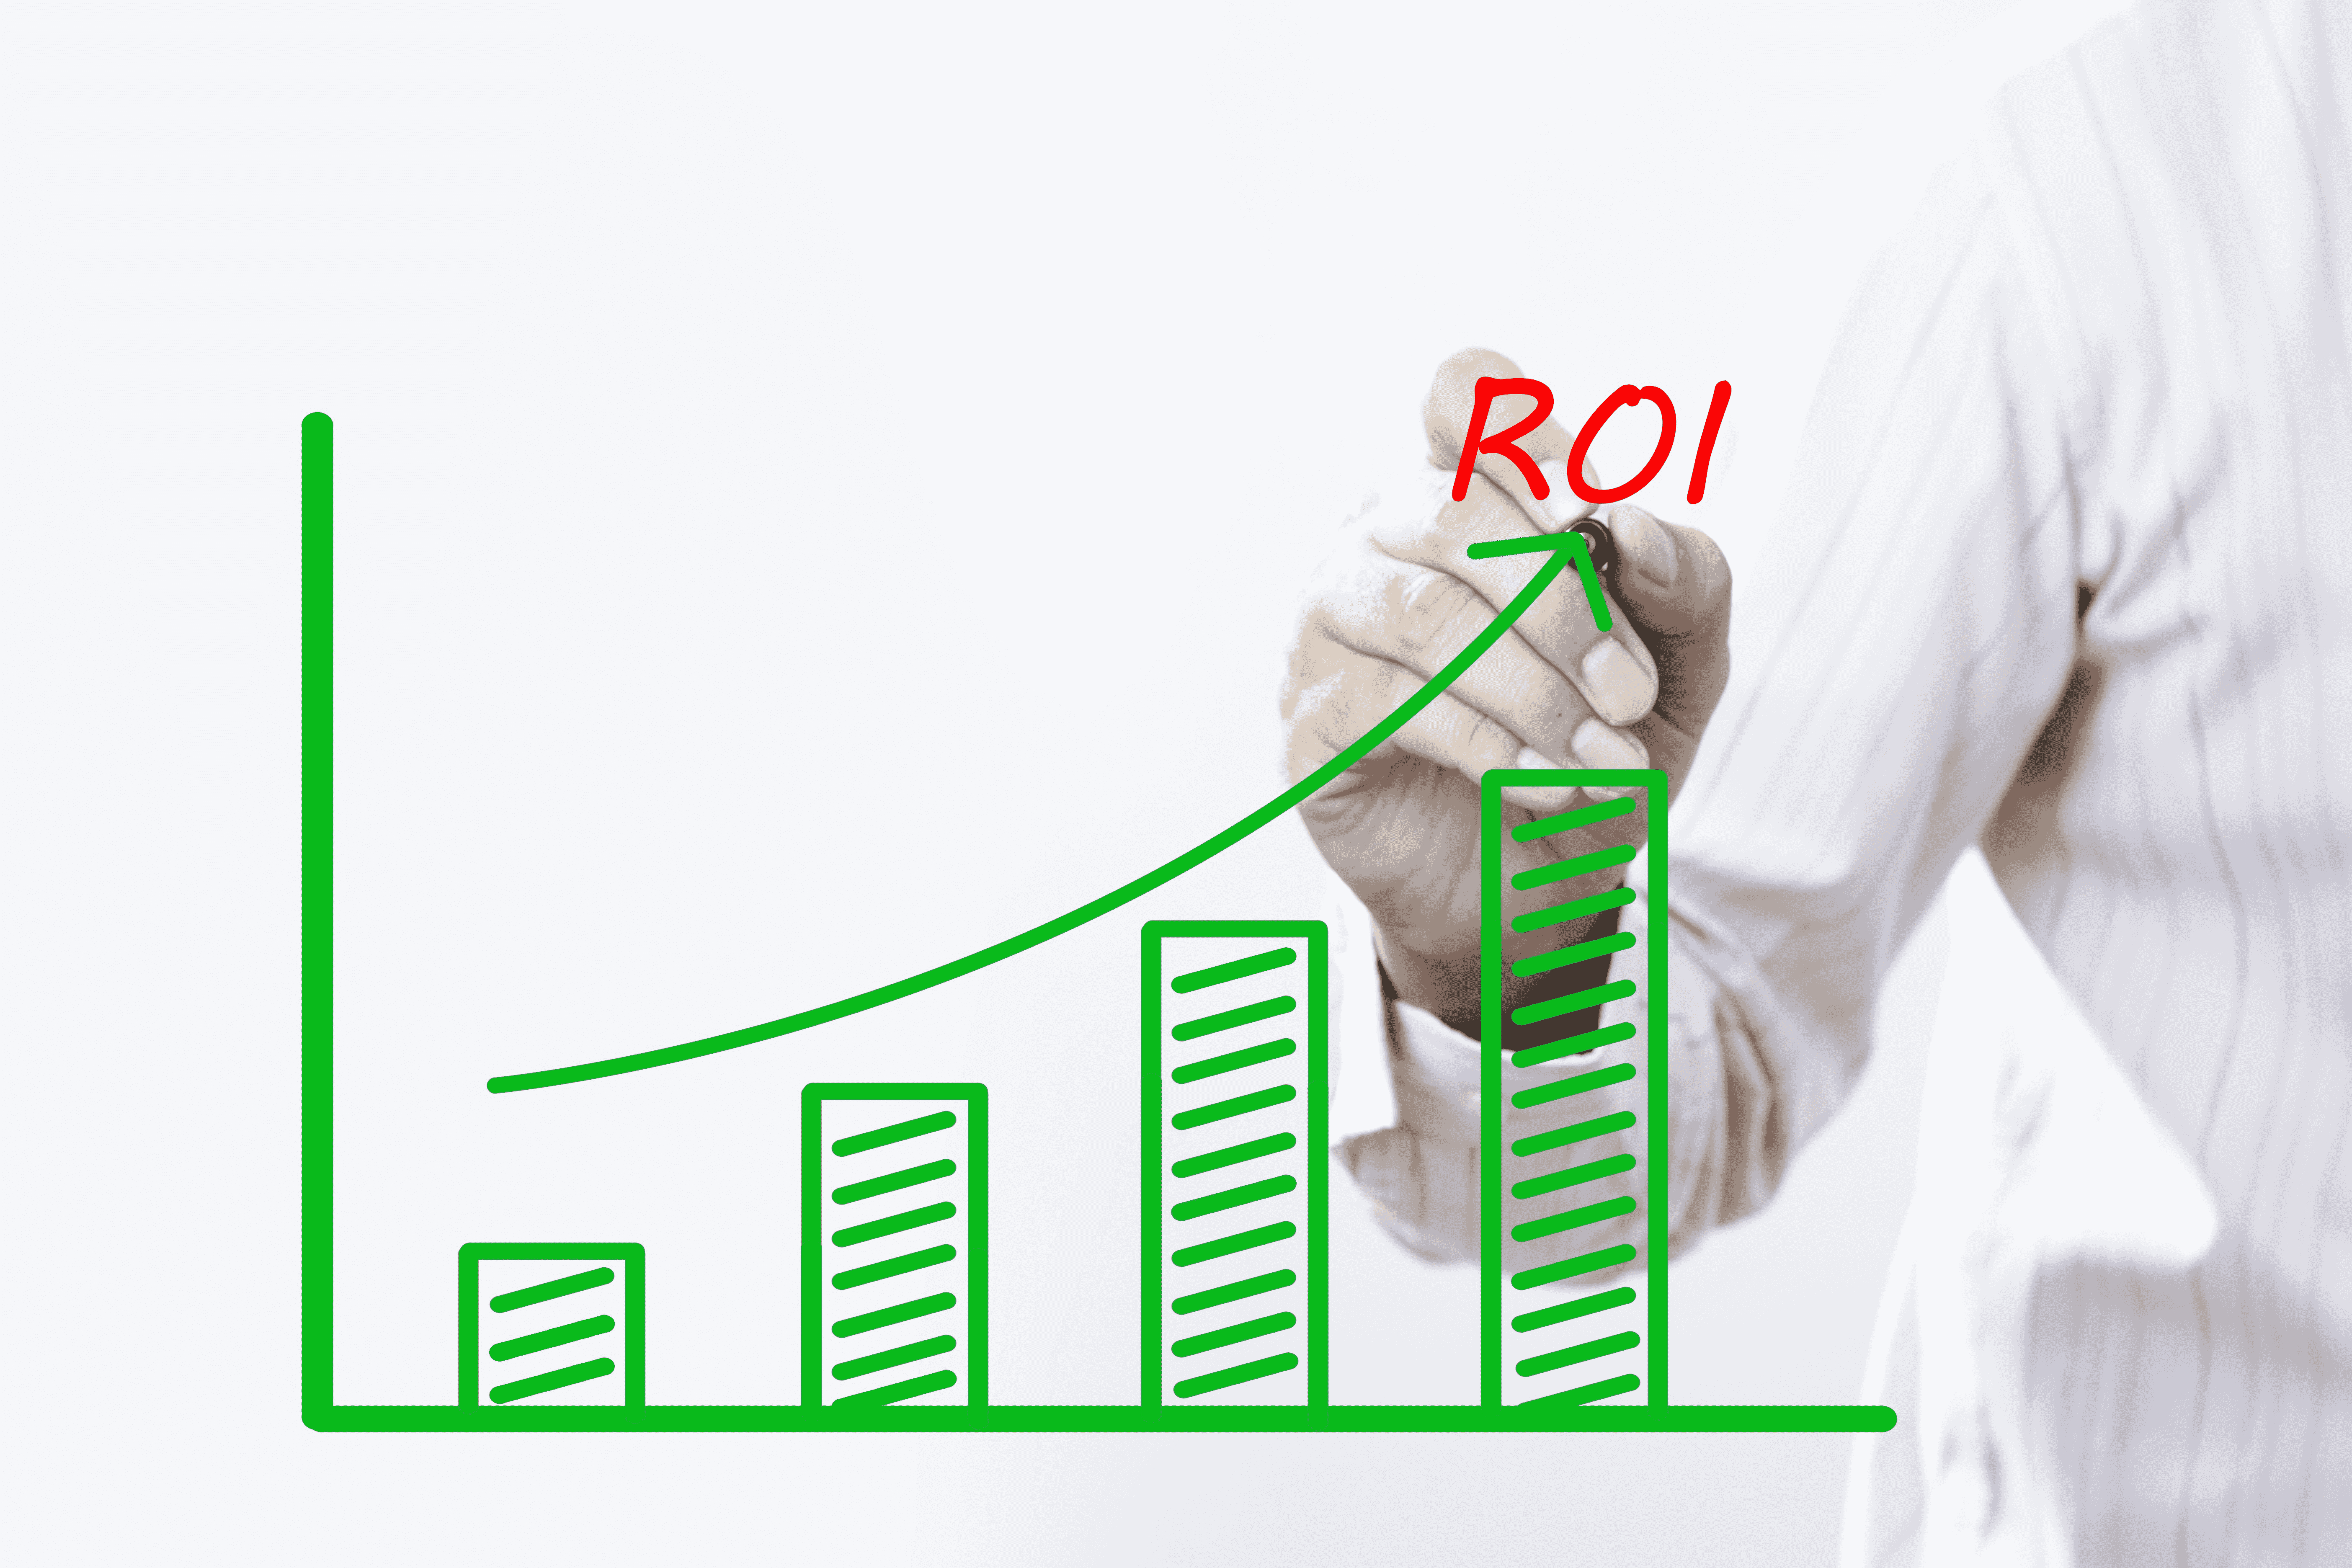
Understanding ecommerce data ROI is the foundation of building a sustainable KPI framework. Use a growth checklist for brands to audit which metrics your current stack even has the ability to produce reliably before adding more.
“A KPI that no one acts on is just noise. Build your reporting around the five to seven numbers that trigger a meeting, a budget shift, or a creative test.”
Pro Tip: Start your KPI selection by listing your top three business objectives for the quarter. Then ask: which single metric best confirms we are on track for each objective? That gives you your core three. Add two to four supporting metrics to diagnose why the core numbers are moving, and stop there.
14 essential ecommerce KPIs (with real-world examples)
Now let’s break down the top ecommerce KPIs you should be tracking, complete with calculation tips and contextual examples.
These 14 KPIs cover the full funnel: acquisition, conversion, profitability, retention, and operational efficiency. Each one includes a formula, a practical example, and a red flag signal to watch.
-
Conversion Rate (CR). CR = (Orders / Sessions) x 100. If your Shopify store records 50,000 sessions and 1,500 orders in a month, your CR is 3%. The category benchmark matters. A 2% CR in consumer electronics is solid; 2% in consumables is a warning sign.
-
Average Order Value (AOV). AOV = Revenue / Orders. A brand doing $500,000 in revenue from 5,000 orders has an AOV of $100. Bundling strategies and add-on offers are the fastest ways to lift AOV without increasing ad spend.
-
Customer Lifetime Value (LTV). LTV = AOV x Purchase Frequency x Lifespan x Gross Margin. A customer who buys twice per year at $80 AOV with a 40% margin and stays for 3 years has an LTV of $192. LTV is the single most underused metric in marketplace advertising decisions.
-
Customer Acquisition Cost (CAC). CAC = Marketing Spend / New Customers. If you spend $30,000 in a month and acquire 600 new customers, your CAC is $50. Pairing CAC with LTV to get your LTV:CAC ratio is the real signal. Anything below 3:1 deserves urgent attention.
-
Return on Ad Spend (ROAS). ROAS = Revenue / Ad Spend. A $10,000 ad budget generating $40,000 in sales is a 4x ROAS. On Amazon, ROAS alone can mislead if your margins are thin, so always calculate ROAS alongside Gross Margin.
-
ACOS (Advertising Cost of Sale). ACOS = Ad Spend / Ad Revenue x 100. It is the inverse of ROAS and the dominant profitability metric on Amazon. A 25% ACOS on a product with a 35% margin leaves room. A 25% ACOS on a 22% margin product is a cash drain.
-
Cart Abandonment Rate (CAR). CAR = (Abandoned Carts / Initiated Checkouts) x 100. The global average sits around 70%, which means most brands have significant recoverable revenue sitting in abandoned checkouts. Explore proven cart abandonment recovery tactics to start capturing that revenue immediately.
-
Gross Margin. Gross Margin = (Revenue minus COGS) / Revenue x 100. If you sell a product for $60 and it costs $24 to produce and ship, your gross margin is 60%. Gross Margin anchors every profitability conversation and should be calculated per SKU, not just at the account level.
-
Repeat Purchase Rate. Repeat Purchase Rate = (Customers Who Bought More Than Once / Total Customers) x 100. A 30% repeat purchase rate means nearly one in three customers came back. For subscription-adjacent categories, this number should be above 40% to justify aggressive acquisition spend.
-
Order Defect Rate (ODR). ODR measures the percentage of orders with a defect: negative feedback, A-to-Z claims, or chargebacks. Amazon requires ODR below 1%. Anything approaching that threshold risks account suspension and is a clear signal of fulfillment or product quality problems.
-
On-Time Delivery Rate (OTDR). Walmart’s marketplace requires OTDR above 95%. Brands that dip below this threshold face placement penalties that can dramatically suppress organic visibility. OTDR is a supply chain KPI as much as a marketplace metric.
-
Inventory Turnover. Inventory Turnover = COGS / Average Inventory. A brand with $2M COGS and $500,000 in average inventory turns over 4 times per year. For fast-moving consumer goods, you want this number above 6. High-ticket items may be healthy at 2 to 3.
-
Net Promoter Score (NPS) or Review Velocity. Review Velocity (new reviews per week) is a practical proxy for NPS on marketplaces. It directly impacts organic ranking on both Amazon and Walmart. A product gaining 10+ verified reviews per week is building a compounding visibility advantage.
-
Revenue Per Visitor (RPV). RPV = Total Revenue / Total Visitors. RPV combines CR and AOV into a single number that reflects monetization efficiency. It is particularly useful for ecommerce retention strategies because returning visitors almost always produce higher RPV than first-time visitors, making segmentation critical.
Pro Tip: A conversion rate optimization agency can help you build dashboards that display CR and RPV side-by-side, so you immediately spot whether a CR drop is hurting total revenue or whether AOV is compensating.
Side-by-side comparison: Which KPI matches your business goal?
With these definitions in hand, here’s how each KPI aligns with different business goals and which metrics matter most for your brand’s current stage.
Analyzing ecommerce conversion rates in isolation never tells the full story. You need to pair each KPI with a clear business objective and a platform context. The table below maps the 14 KPIs to the scenarios where they deliver the most signal.
| KPI | Primary business goal | Best platform context | Team owner |
|---|---|---|---|
| Conversion Rate | Revenue growth | Amazon, Shopify | Marketplace, CRO |
| AOV | Revenue growth | Shopify, Walmart | Merchandising |
| LTV | Retention and profitability | Shopify, Amazon | Marketing, Finance |
| CAC | Cost efficiency | All platforms | Paid media |
| ROAS | Ad efficiency | Amazon, Walmart | Paid media |
| ACOS | Margin protection | Amazon | Paid media |
| Cart Abandonment Rate | Revenue recovery | Shopify | Email, CRO |
| Gross Margin | Profitability | All platforms | Finance, Ops |
| Repeat Purchase Rate | Retention | Shopify, Amazon | Retention/CRM |
| ODR | Account health | Amazon | Operations |
| OTDR | Account health | Walmart | Supply chain |
| Inventory Turnover | Capital efficiency | All platforms | Supply chain |
| Review Velocity | Organic visibility | Amazon, Walmart | Brand/content |
| RPV | Monetization efficiency | Shopify, Amazon | Analytics |
Notice that some KPIs are owned by multiple teams. Gross Margin, for example, is not just a finance number. It directly informs how aggressively your paid media team should bid on branded versus non-branded keywords. Over-reliance on ads erodes margins if LTV:CAC falls below 3:1, which means margin and media teams need to review these numbers together in a shared cadence.

Explore top ecommerce tools to see which platforms natively surface these KPIs versus which ones require a third-party analytics layer.
KPI pitfalls and advanced tips for marketplace brands
With an overview of the most important KPIs, it’s equally important to avoid the mistakes and blindspots that cost brands real margin.
Top 5 KPI tracking errors brands make:
-
Reporting blended ROAS instead of SKU-level ROAS, masking loss leaders
-
Ignoring return rates until they appear on the P&L rather than tracking them weekly
-
Using total revenue as a north star without segmenting by channel or customer cohort
-
Treating inventory turnover as a yearly metric instead of reviewing it monthly
-
Failing to adjust KPI benchmarks by season, making Q4 spikes look like permanent gains
High return rates in apparel can reach 40%, which makes a detailed size guide and precise product imagery non-negotiable. For consumer electronics, low inventory turnover below 2 ties up capital and often signals a pricing or listing quality issue rather than a demand problem. These industry-specific edge cases require you to calibrate benchmarks against your category, not generic industry averages.
Category KPI benchmarks:
| Metric | Apparel benchmark | Consumer electronics benchmark |
|---|---|---|
| Return Rate | 25 to 40% | 5 to 10% |
| Inventory Turnover | 4 to 6x per year | 2 to 4x per year |
| Gross Margin | 50 to 65% | 15 to 30% |
| CR (Amazon) | 8 to 12% | 5 to 8% |
| LTV:CAC ratio | 3:1 or higher | 2.5:1 or higher |
Effective inventory management for ecommerce is inseparable from KPI accuracy. If your inventory data is stale, your Inventory Turnover and ACOS calculations will be off, and so will every decision downstream.
Seasonal adjustments matter too. During Q4, your ACOS will likely rise and your CAC will spike due to auction pressure on Amazon and Walmart. Brands that understand this pattern set quarterly KPI targets rather than static annual ones, and they avoid panic budget cuts during peak periods that actually deliver their highest LTV customers.
“Understanding online profitability starts with knowing which numbers to trust. The metric you optimize is the metric your team will chase, so make sure the metric reflects actual business health.” See more on understanding online profitability.
Pro Tip: Build a “KPI health check” as a single Slack or Teams message sent every Monday morning. It should show five numbers only: ACOS, CR, AOV, LTV:CAC, and Inventory Turnover. If any number is outside its threshold, that becomes the agenda item for the week’s review call.
Why less is more: The real secret of high-performing ecommerce teams
Here’s a pattern we see consistently across the brands that scale fastest: they track fewer metrics than their competitors, not more. That’s counterintuitive, but it holds up in practice. When every team member can recite the five numbers that matter this week, decisions happen faster, testing cycles are tighter, and accountability is clearer.
Most mid-market brands accumulate KPIs the same way they accumulate SKUs. Someone reads a blog post about NPS, adds it to the dashboard. A new channel manager joins and layers in their preferred metrics. Six months later, the weekly report is 40 slides long and the most important numbers are buried on page 17. This is how good teams lose the ability to act quickly.
The solution is not a better tool. It is a structural decision: one north star metric per team, reviewed every week, with two to three diagnostic metrics that explain movement in the north star. For your paid media team, ACOS is the north star and ROAS plus CAC are the diagnostics. For your retention team, Repeat Purchase Rate is the north star and LTV plus Review Velocity are the diagnostics.
Increasing ecommerce ROI is rarely about finding a new metric to track. It’s about making your existing metrics more actionable by reducing the noise around them. The brands we work with that have the most disciplined KPI cultures are not the ones with the most sophisticated analytics stacks. They’re the ones where every person on the team knows what “good” looks like and can explain in one sentence what they are doing to get there.
Supercharge your KPI strategy with Nectar’s platform and expertise
If you’re ready to turn KPI insights into stronger growth and profitability, here’s how Nectar can help you leap ahead.
Knowing your KPIs is step one. Acting on them consistently, at scale, across multiple platforms, is where most brands struggle. Nectar’s proprietary iDerive analytics platform is built specifically to surface the metrics that matter for Amazon, Walmart, and Shopify brands, so your team spends less time building reports and more time making decisions.
From creative production that lifts CR and RPV to full-funnel advertising management that keeps ACOS in check, every service Nectar provides connects back to the KPIs this guide covers. Whether you need help with Amazon growth optimization, Shopify solutions that improve retention and AOV, or an end-to-end strategy across all three channels, Nectar’s team brings both the analytics depth and the creative execution to make the numbers move. Explore all services for ecommerce growth to see how a fully managed approach can transform your KPI performance.
Frequently asked questions
What is the difference between CR and ROAS?
CR = (Orders / Sessions) x 100 measures the percentage of sessions that result in purchases, while ROAS = Revenue / Ad Spend calculates how much revenue is generated per advertising dollar spent. CR reflects listing and page quality; ROAS reflects media efficiency.
How many KPIs should an ecommerce brand track?
Focusing on 5 to 7 metrics consistently outperforms tracking 20 or more, because a smaller set forces clarity and makes it easier to assign ownership and drive action across teams.
Which KPIs should Amazon sellers prioritize?
Amazon sellers should prioritize ACOS, ODR and OTDR for account health, Conversion Rate for listing performance, and LTV for long-term profitability. These five metrics cover both marketplace compliance and business sustainability.
What is a healthy inventory turnover ratio?
An inventory turnover ratio above 2 is generally considered healthy, but low inventory turnover below 2 signals that too much capital is tied up in unsold stock, which erodes cash flow and increases storage costs.
Why is customer lifetime value (LTV) important?
LTV = AOV x Purchase Frequency x Lifespan x Gross Margin captures the total profit a brand earns from a single customer relationship, making it the most reliable metric for setting acquisition budgets and evaluating long-term marketing effectiveness.
Recommended
-
Nectar Blog | How to Analyze Ecommerce Data for Higher Conversion Rates
-
Nectar Blog | 7 Top 2025 Ecommerce Marketing Tips for Brand Growth
-
Nectar Blog | How to Increase Ecommerce ROI with Data and Creative
-
Nectar Blog | Q4 Ecommerce Strategy Guide for Maximizing Sales Results
-
Essential KPIs for Etsy Ads: Boost ROI With Smarter Tracking