{
"@type": "Article",
"image": {
"url": "https://csuxjmfbwmkxiegfpljm.supabase.co/storage/v1/object/public/blog-images/organization-10884/1776743243664_Strategist-mapping-Shopify-sales-funnel-stages.jpeg",
"@type": "ImageObject",
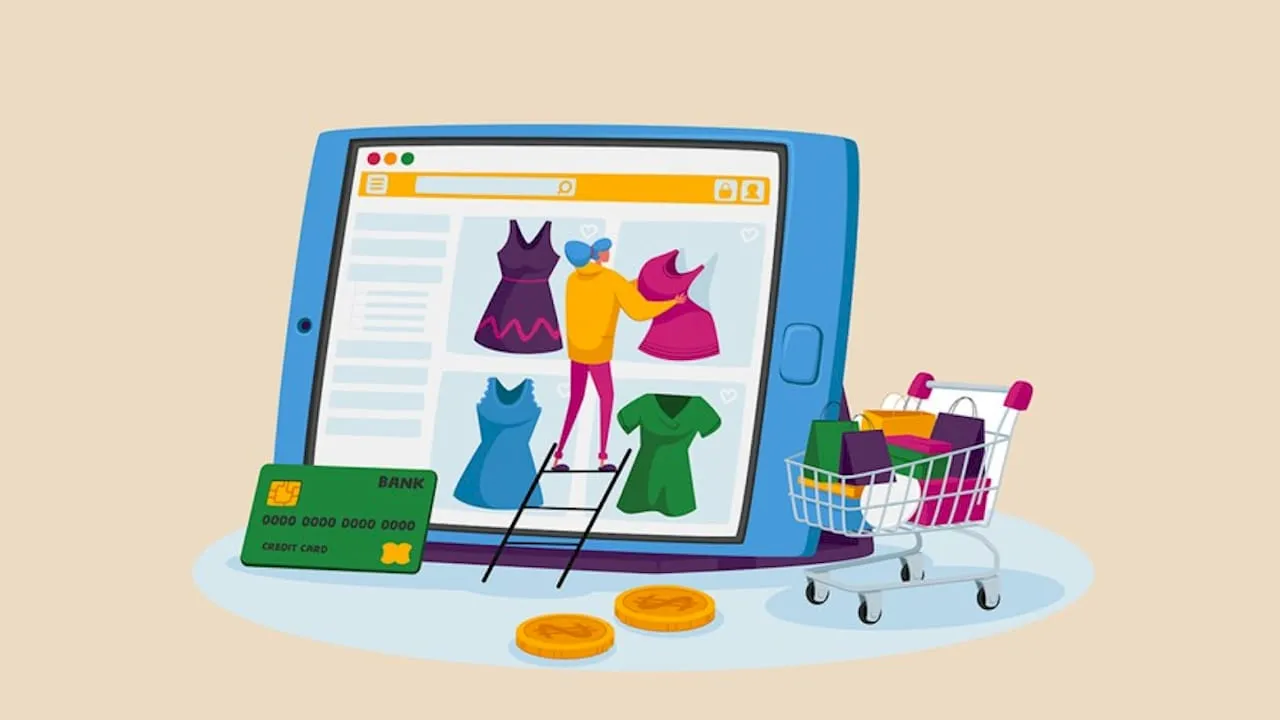
"caption": "Strategist mapping Shopify sales funnel stages"
},
"author": {
"url": "https://thinknectar.com",
"name": "Thinknectar",
"@type": "Organization"
},
"@context": "https://schema.org",
"headline": "Shopify Sales Funnel Guide: Steps to Boost Conversions",
"publisher": {
"url": "https://thinknectar.com",
"name": "Thinknectar",
"@type": "Organization"
},
"inLanguage": "en-US",
"articleBody": "",
"description": "Learn how to optimize your Shopify sales funnel stage by stage, using 2026 benchmarks and data-driven strategies to increase conversion rates and grow revenue.",
"datePublished": "2026-04-21T03:53:07.359Z"
}
Shopify Sales Funnel Guide: Steps to Boost Conversions
.webp)

TL;DR:
- Most Shopify stores experience significant revenue loss at add-to-cart and checkout stages.
- Accurate tracking and staged optimizations are essential for improving conversion rates.
- Continuous, data-driven testing and segmentation help top brands dominate their funnels.
Most Shopify stores bleed revenue at every funnel stage without knowing exactly where or why. Add-to-cart rates average 7.23% while checkout abandonment sits at nearly 50%, meaning roughly half your shoppers vanish right before purchasing. The gap between an average store converting at 1.4% and a top performer hitting 7.1% isn’t luck. It’s a deliberate system of staged improvements, accurate tracking, and rapid iteration. This guide walks you through every layer of that system, from setting up proper funnel analytics to stage-specific optimizations and the metrics that tell you when you’re winning.
Key Takeaways
| Point | Details |
|---|---|
| Know your funnel benchmarks | Understanding where you stand compared to 2026 industry averages reveals the biggest optimization opportunities. |
| Prep with the right tools | Accurate tracking and analytics are essential before making funnel changes. |
| Target every funnel stage | Optimizing each step—from awareness to checkout—drives higher conversions and revenue growth. |
| Measure and iterate | Continuous monitoring and testing let you fix issues and build repeatable sales from your funnel. |
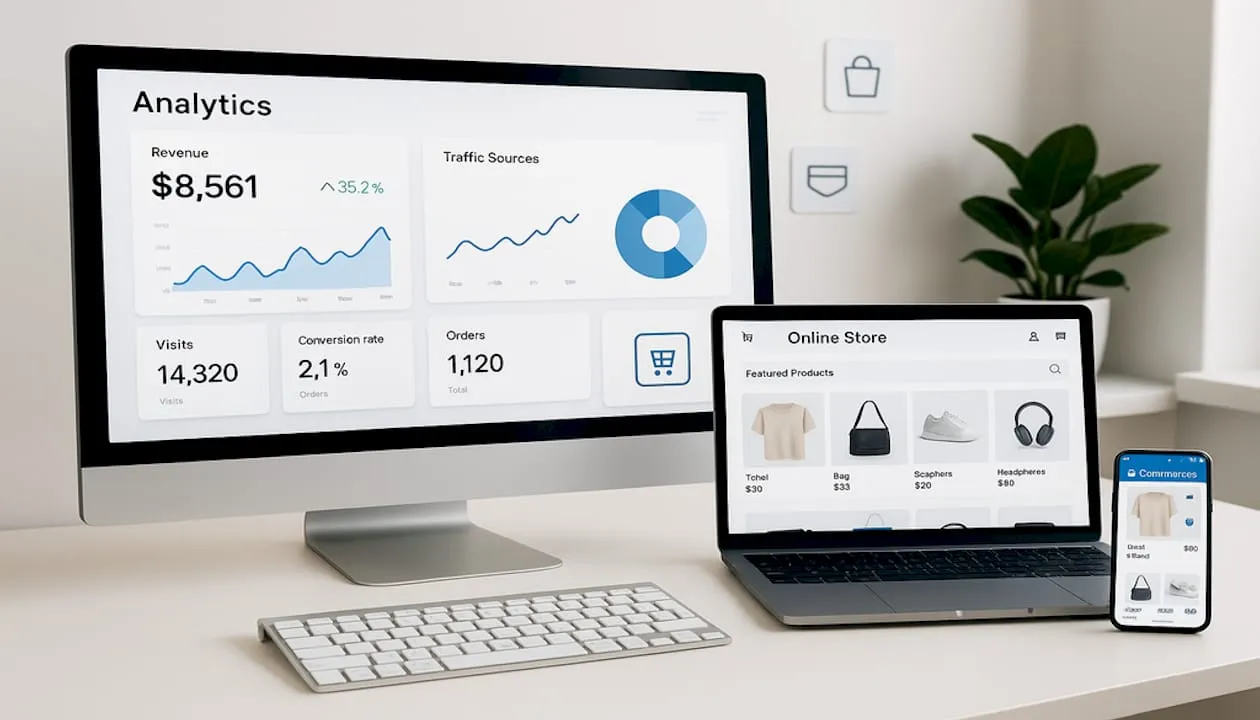
Understanding the Shopify sales funnel: Stages and benchmarks
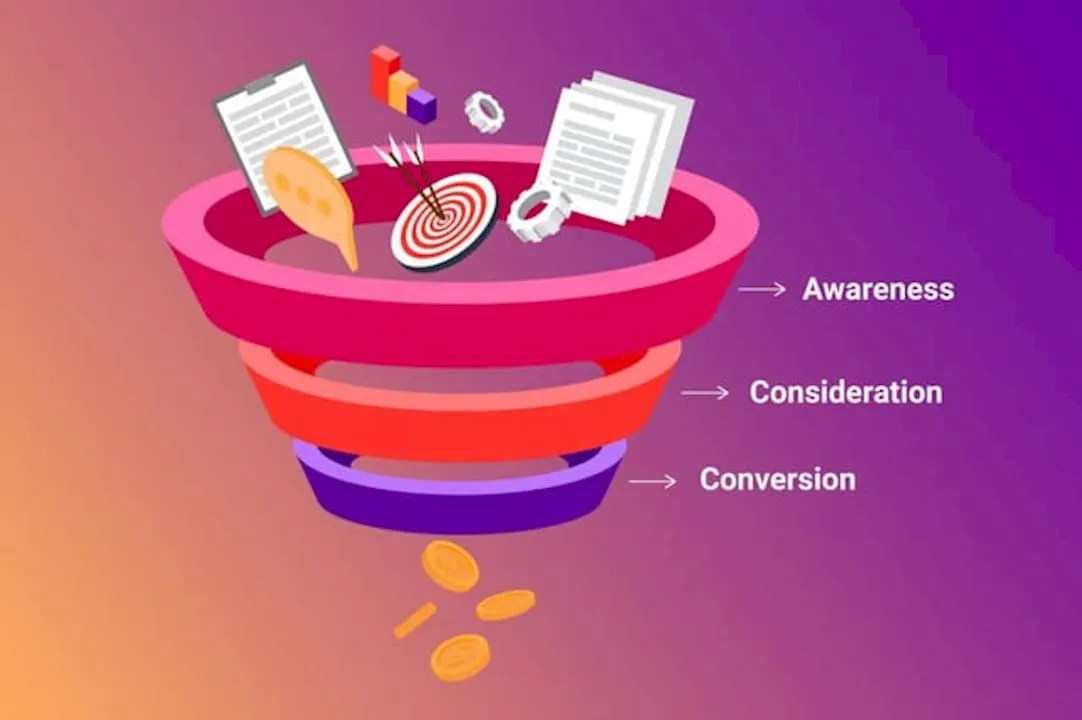
Before you can fix the funnel, you need a clear map of it. The Shopify sales funnel moves through five core stages: awareness (traffic arriving at your store), product discovery (browsing collection or landing pages), product view (engaging with a specific product page), add-to-cart, and checkout through purchase. Each transition is a filter. Most brands lose the vast majority of visitors between stages, and the losses compound fast.
The most damaging drop-offs happen in two predictable places. First, very few visitors actually add a product to their cart, with industry add-to-cart rates averaging just 7.23%. Second, nearly half of those who start checkout never finish, with checkout abandonment at 49.8%. Even a small improvement in either of these stages creates outsized revenue gains.
Here’s how 2026 benchmarks break down across key dimensions:
| Segment | Conversion rate range |
|---|---|
| All Shopify stores (overall) | 1.4% to 3.0% |
| Top 10-20% of stores | 4.7% to 7.1% |
| Apparel stores | 1.8% to 3.4% |
| Food and beverage stores | 2.0% to 6.0% |
| Email traffic | ~4.1% |
| Paid ad traffic | ~1.2% |
| Mature stores (established) | ~2.8% median |
This table should shift your perspective on what’s possible. If your store runs on mostly paid traffic at 1.2% CVR, you’re not broken. But if email traffic is also underperforming relative to its 4.1% benchmark, something deeper is off with your messaging or post-click experience.

Key insight: industry and traffic source matter enormously. A food brand comparing itself to apparel benchmarks will draw the wrong conclusions. Always segment your funnel metrics by traffic source, device, and customer segment before making optimization decisions. That granularity is what separates tactical adjustments from guesswork.
Key funnel drop-off facts for 2026:
- Average add-to-cart rate: 7.23%
- Average checkout abandonment: 49.8%
- Top-performing stores convert at more than double the average rate
- Email converts 3.4x better than paid ads on average
Prepping for optimization: Tools, tracking, and prerequisites
Optimization without data is renovation without a floor plan. You might move things around, but you’ll have no idea if they ended up in the right place. Before touching a single page element, make sure you have the right instrumentation in place.

Accurate funnel tracking is the prerequisite that most brands skip or set up incorrectly. Shopify Analytics covers the basics, but enterprise managers need more depth. Google Analytics 4 with enhanced e-commerce tracking gives you stage-level visibility. Session recording tools like Hotjar or FullStory surface the behavioral context that numbers alone can’t explain.
Here’s a comparison of the core tool categories you need:
| Tool category | Purpose | Examples |
|---|---|---|
| Funnel analytics | Stage-by-stage drop-off visibility | GA4, Shopify Analytics |
| Session recording | Behavioral insights and friction discovery | Hotjar, FullStory |
| A/B testing | Validate changes before full rollout | Optimizely, Convert |
| CRM and email | Recover abandoners and segment audiences | Klaviyo, Omnisend |
| Heatmaps | Identify where attention goes on key pages | Crazy Egg, Microsoft Clarity |
For data analysis for conversions to be reliable, your event tracking must be clean. Set up custom GA4 events for each funnel stage: page_view, view_item, add_to_cart, begin_checkout, and purchase. Verify that data is flowing correctly in GA4 DebugView before running any tests or drawing conclusions.
Pro Tip: Never launch an A/B test without first calculating your required sample size. Running tests with too little traffic produces false positives. Use a free sample size calculator and target at least 95% statistical significance before calling a winner. Most brands end tests too early and implement changes that actually hurt long-term performance.
Your readiness checklist before starting funnel optimization:
- GA4 enhanced e-commerce events firing correctly
- Baseline conversion data for at least 30 days
- A/B testing tool installed and validated
- Session recordings active on high-drop-off pages
- CRM integrated with Shopify for behavioral segmentation
Check off every item on that Shopify optimization checklist before proceeding. Jumping to execution without this foundation wastes test cycles and produces unreliable results.
Step-by-step: Optimizing each stage for higher conversions
With clean data and the right tools in place, you can attack each funnel stage with precision. Here’s a structured walkthrough, ordered by stage.
-
Top of funnel: Traffic quality and collection pages. Irrelevant traffic inflates bounce rates and distorts your CVR. Audit your paid campaigns for audience-to-landing-page alignment. For improving return on ad spend, match ad creative and copy to the exact collection or product page you’re sending shoppers to. Collection pages should load fast, filter intuitively, and surface bestsellers or high-margin products first.
-
Middle funnel: Product pages and trust signals. Your product page is where intent converts or dies. Use high-quality imagery, benefit-focused copy above the fold, and social proof that addresses real objections. Add trust signals like review counts, return policies, and security badges near the add-to-cart button. Product listing optimization at this stage often produces the highest CVR lift with the lowest implementation cost.
-
Checkout optimization. Top-performing stores achieve checkout conversion rates of 4.7% to 7.1%. The gap usually comes down to friction: too many form fields, limited payment options, or surprise shipping costs at the final step. Enable Shop Pay, offer express checkout options, and show a clear order summary with shipping costs early. Remove any unnecessary steps or account creation requirements.
-
Cart abandonment recovery. A 49.8% checkout abandonment rate is a recoverable problem, not a fixed cost. Set up automated email and SMS flows that trigger within 30 minutes of abandonment. Personalize the message with the exact product left behind. For cart abandonment recovery, a three-email sequence outperforms a single reminder by a significant margin.
Pro Tip: Use UTM parameters to segment your checkout traffic by source, then apply dynamic discount logic or urgency messaging tailored to that source. Retargeted visitors often respond better to social proof, while email subscribers tend to convert on loyalty-based offers.
“Best-in-class brands double down on abandoned checkout recovery, treating it not as a fallback tactic but as a core revenue channel. A well-built recovery sequence can recapture 10% to 15% of lost checkouts every month.”
Measuring impact and troubleshooting common mistakes
After implementing changes, the work isn’t over. The iteration loop is what separates brands that compound their gains from those that plateau after an initial CVR lift.
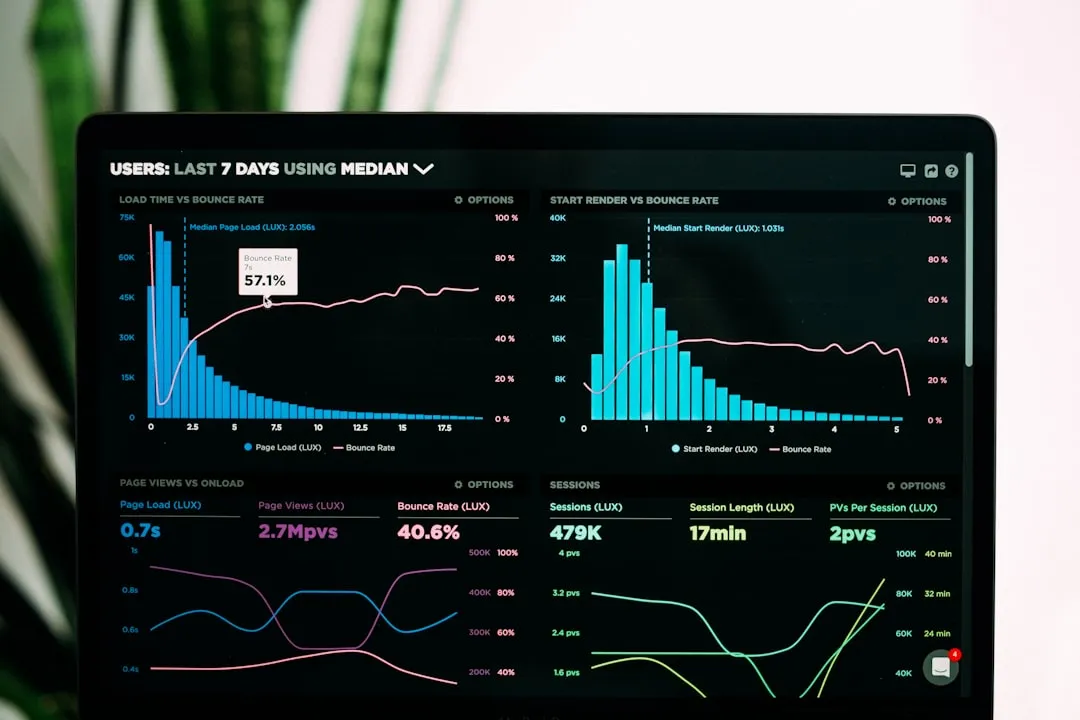
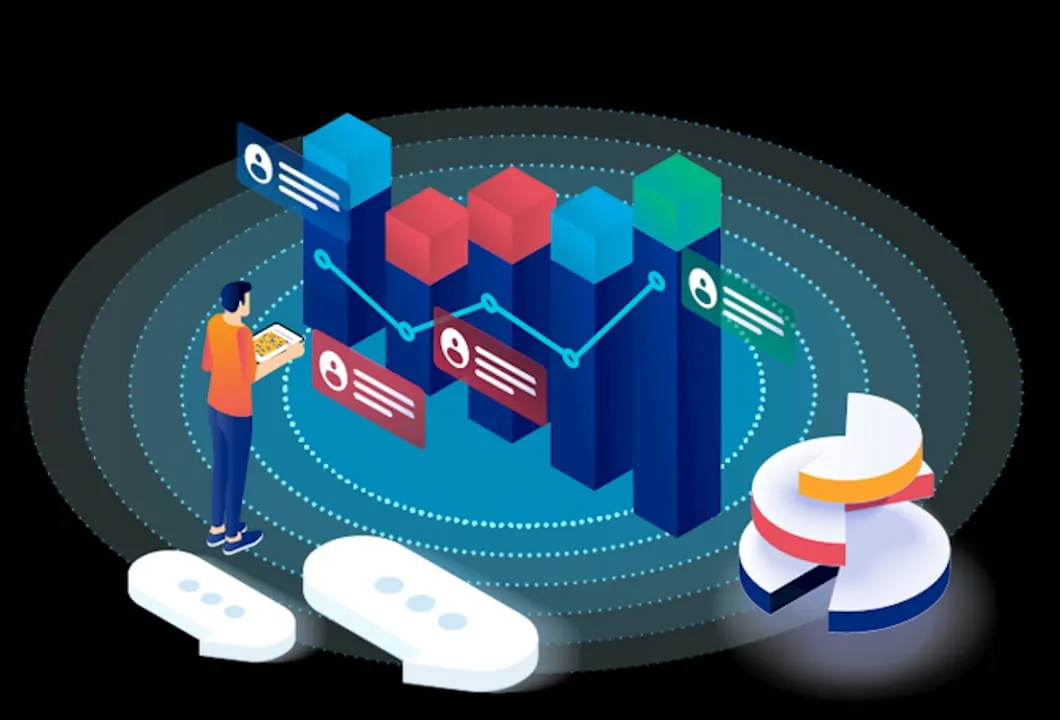
Ongoing funnel metric tracking at each stage is the only way to know whether your changes worked, and whether they’re still working three months from now. Build a simple dashboard that shows stage-by-stage conversion rates weekly, segmented by device and traffic source.
| Metric | What it tells you | Review frequency |
|---|---|---|
| Add-to-cart rate | Product page effectiveness | Weekly |
| Checkout abandonment rate | Checkout UX and trust issues | Monthly |
| Overall CVR by source | Traffic quality and landing page fit | Weekly |
| Revenue per session | Combined funnel efficiency | Monthly |
| Mobile vs. desktop CVR gap | Mobile UX problems | Monthly |
Common mistakes that kill conversion rates after initial optimization:
- Unoptimized mobile UX. Over 60% of Shopify traffic is mobile, yet most optimization work focuses on desktop. If your mobile CVR lags desktop by more than 30%, mobile UX is the bottleneck.
- Weak value propositions. Shoppers need a clear reason to choose you over competitors. If your above-the-fold messaging focuses on product features rather than customer outcomes, your product pages will underperform.
- Ignoring micro-conversions. Tracking only final purchases misses early signals. Monitoring add-to-cart rates, time on product page, and scroll depth gives you faster feedback loops.
- Testing too many variables at once. Multi-variable tests on single pages make it impossible to isolate what drove a change. Test one element at a time.
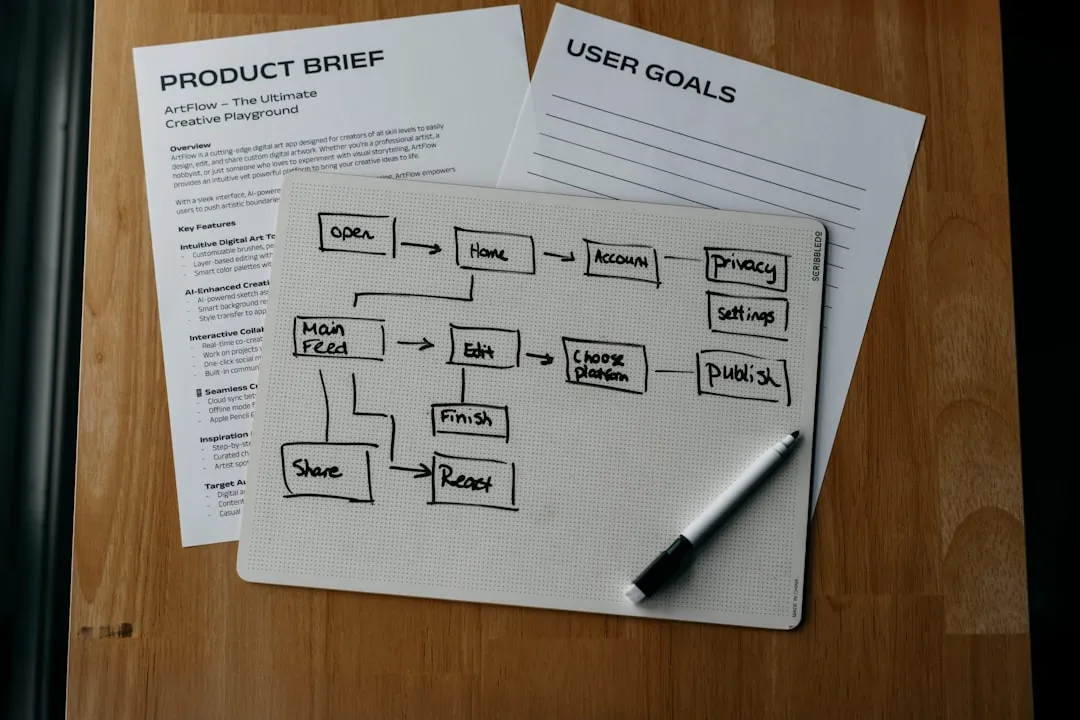
For perfect shopping experience design, revisit your funnel map every quarter. Use session recordings to watch real user journeys on pages that underperform versus benchmarks, and feed those observations into your next test cycle. Pair qualitative insight with quantitative data for your growth strategy for brands to stay ahead of performance plateaus.
Why most Shopify sales funnel advice falls short
Most optimization guides give you a list of tweaks. Add trust badges, speed up your page, simplify checkout. That advice isn’t wrong, but it’s incomplete in ways that matter at scale.
What those guides skip is the compounding value of micro-optimizations built on real behavioral data. A 0.3% CVR lift sounds small until you apply it across a $10M store running 500,000 sessions a month. At that scale, micro-optimizations generate seven-figure annual revenue swings.
They also skip cross-channel complexity. Traffic diversification across paid, organic, email, and social means your funnel needs to perform differently for each audience segment. A single checkout flow optimized for one source will leak revenue from others. The reality of funnel analysis at the enterprise level demands segment-specific strategies, not universal templates.
The brands winning in 2026 run continuous test cycles, not quarterly audits. They use behavioral data to personalize product page experiences by segment. And they measure everything at a granular enough level to catch problems before they become patterns. Generic funnel advice can get you to average. Systematic, data-driven iteration is what gets you to the top 10%.
Accelerate your Shopify growth with strategic support
Optimizing a Shopify sales funnel at scale requires more than a checklist. It demands expert strategy, real-time analytics, and high-impact creative execution working together.
Nectar’s Shopify solutions combine full-funnel management with proprietary analytics to surface exactly where your store is losing revenue and how to fix it fast. From creative e-commerce support including photography, design, and copy, to data-driven ad strategies and our content analytics platform iDerive, we give your team the infrastructure to scale profitably. If you’re ready to move from average conversion rates to top-tier performance, our team is built for exactly that challenge.
Frequently asked questions
What is a good Shopify conversion rate in 2026?
A good Shopify conversion rate in 2026 is between 1.4% and 3% for most stores, with top-performing brands reaching 4.7% to 7.1%.
How do I identify the biggest drop-off in my Shopify funnel?
Review stage-by-stage analytics and look for sharp declines, particularly at add-to-cart and checkout, where abandonment rates are highest.
Which tools are essential for tracking Shopify sales funnel performance?
Shopify Analytics, Google Analytics 4 with enhanced e-commerce events, and a dedicated A/B testing tool are the core stack for reliable funnel tracking.
What is the fastest way to improve my Shopify funnel?
Start by optimizing your product pages and checkout flow, then layer in cart abandonment recovery sequences to recapture revenue from already-engaged shoppers.
How often should I audit my funnel metrics?
Run a detailed funnel audit at minimum every quarter, and review high-impact stages like checkout abandonment monthly to catch issues before they compound.
Recommended
- Nectar Blog | Shopify store optimization guide: boost sales by 40%
- Nectar Blog | Shopify optimization checklist for higher conversions
- Nectar Blog | Master Shopify Advertising Workflow for Better ROI
- Nectar Blog | How to Boost Amazon Conversion Rates for E-Commerce Brands
- What is a high conversion website? Guide to more leads
- Best sales automation examples for e-commerce success | SuperSocial Blog


.webp)


%20(1).webp)