Role of data in scaling brands: The e-commerce manager's guide
.webp)

TL;DR:
- Most stalled e-commerce brands falter due to fragmented data that delays confident decision-making. Building a unified data infrastructure and tracking key KPIs like Unit Session Percentage unlocks scalable, data-driven growth. Implementing real-time retail signals and incrementality measurement ensures more accurate media attribution and sustained success.
Most e-commerce brands that stall despite heavy investment are not failing because of weak creative or poor ad spend. The real culprit behind slow growth is almost always fragmented data that prevents fast, confident decisions. The role of data in scaling brands goes far beyond reporting — it determines how quickly you can test, learn, and execute at marketplace speed. This guide walks you through the mechanics of unified data infrastructure, listing-level conversion measurement, Walmart’s expanded retail data capabilities, and cross-channel incrementality measurement so you can build a data-driven brand growth engine that compounds over time.
Why unified data is the foundation for scaling your brand
The importance of data in branding is not about having more data. It is about having connected data. Most brand managers at mid-sized companies are working across Amazon Seller Central, Walmart Seller Center, Shopify back-ends, and third-party ad platforms, each with its own reporting dashboard and export logic. The result is fragmented insight that arrives too late and means something slightly different everywhere you look.
A single source of truth (SSOT) solves this by normalizing all your revenue, traffic, and customer data into one unified model that overrides any single platform’s filtered view. When your fulfillment data, ad spend, and conversion metrics share the same schema, you can answer real questions fast: Which SKUs are gaining conversion velocity after an A+ Content refresh? Where is ad spend compressing margin without lifting unit sales?
Poor data integration is the biggest barrier to personalization at scale for between 42 and 47% of marketers, and it directly limits how fast you can grow. The reason is feedback loop speed. When data takes 48 hours to consolidate manually, your experimentation cadence drops from weekly to monthly, and you fall behind brands running tighter cycles.
Key reasons brands without SSOT infrastructure underperform:
-
Inconsistent attribution across Amazon, Walmart, and Shopify makes budget decisions unreliable
-
Data latency (slow aggregation) delays response to real-time inventory and demand shifts
-
Siloed experiments cannot be compared meaningfully without normalized KPI definitions
-
Personalization at scale requires real-time customer segment data that fragmented stacks cannot provide
-
Revenue reporting diverges between finance and marketing teams, slowing executive decisions
“In 2026, scaling a brand depends on building a unified ‘single version of truth’ data foundation. Limited platform integration remains a top barrier to personalization and growth execution.”
Pro Tip: Before investing in any new analytics tool, audit whether your current data sources can be connected through API feeds or a centralized data warehouse. The tool is only as powerful as the inputs feeding it. Start by mapping every data source you currently use and identifying where gaps or manual exports exist.
Understanding how to leverage e-commerce data for ROI starts with this architecture decision. Everything else, including AI, creative testing, and media optimization, runs on top of it.
How data-driven listing optimization powers Amazon and Walmart growth
Once your data foundation is in place, the next layer of data-driven brand growth is at the listing level. This is where the importance of data in branding gets highly specific and measurable. The metric that matters most on Amazon is not your star rating or your review count. It is Unit Session Percentage, which is Amazon’s term for conversion rate: the number of orders divided by the number of sessions.

A+ Content increases sales by 3 to 10% on average, and Unit Session Percentage is the primary KPI for measuring whether those content investments are actually working. Without tracking this before and after a content change, you are guessing.
Here is a systematic approach to data-driven listing optimization:
-
Baseline your Unit Session Percentage before any content change by pulling 30 days of Amazon Brand Analytics data at the ASIN level
-
Publish A+ Content changes or image refreshes through a defined test window of at least 30 days to account for traffic variability
-
Run A/B tests via Amazon’s Manage Your Experiments for title and main image variations, using statistical significance thresholds before calling a winner
-
Track downstream impact including add-to-cart rate and returns, not just the initial conversion lift
-
Repeat on a quarterly cadence so content improvements compound over multiple iterations rather than a single one-time update
Pro Tip: Do not test multiple listing elements simultaneously. If you change the main image, title, and bullet points in one update and see a 7% conversion lift, you have no idea which change drove it. Isolate variables the same way a lab would.
The same logic applies on Walmart. Integrating Walmart retail operational data into listing performance tracking allows you to connect in-store and online behavioral signals to digital content performance. Brands that treat their listing optimization checklist as a living document tied to conversion KPIs consistently outperform those who treat it as a one-time launch task.
For tactical details on conversion execution, boosting Amazon conversion rates breaks down specific content and keyword structures that move the Unit Session Percentage needle.
Unlocking omnichannel retail insights with Walmart’s Scintilla Media Data Feed
Walmart’s Scintilla Media Data Feed represents one of the most significant shifts in how brands can use data to scale retail media investments. Scintilla offers secure API access to 500-plus retail metrics, connecting Walmart’s operational data directly to media partners and agency platforms for closed-loop measurement.
What this means practically is that your agency or analytics platform can pull Walmart’s first-party retail data, including inventory levels, sales velocity, and digital transactability signals, directly into the same environment where your media decisions are being made. The manual export-and-reconcile loop is eliminated.
Key capabilities this data feed unlocks for brand managers:
-
Geo-targeted media activation based on regional inventory and competitor market share data
-
Real-time campaign pacing adjustments tied to actual sell-through velocity, not estimated demand
-
Competitive gap identification by connecting share-of-shelf data to advertising response curves
-
Full-funnel measurement that connects awareness media to downstream in-store and online purchase transactions
-
Operational alignment between supply chain realities and advertising spend timing
“Brands that connected Walmart retail operational data to their media buying decisions through Scintilla saw a 2.97% sales lift in pilot campaigns, with substantially improved return on ad spend attribution.”
The strategic implication is that retail media measurement stops being a reporting exercise and becomes a real-time decision system. When inventory drops below a threshold in a specific region, your media allocation adjusts automatically rather than waiting for a weekly review meeting.
Understanding advertising attribution ROI becomes significantly more accurate when these operational signals are part of the attribution model. Media dollars go to the right placements at the right time because the underlying data is connected rather than siloed.
Why incrementality measurement redefines advertising ROI and brand growth
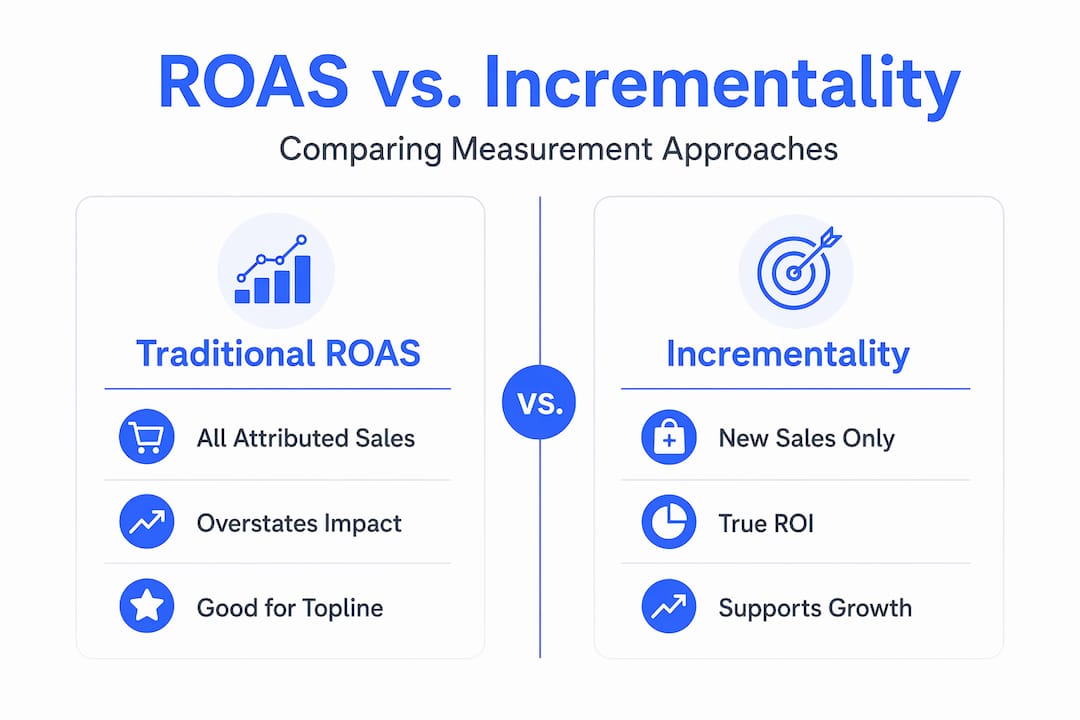
Traditional ROAS has a fundamental flaw: it counts every attributed sale, including purchases that would have happened anyway without the ad. A customer who searches for your brand directly and clicks a branded sponsored product ad was already going to buy. Crediting that sale to your ad inflates ROAS and leads to overspending on low-impact placements.
Incrementality measurement fixes this by isolating the additional sales driven by advertising above the baseline of organic demand. Cross-channel incrementality at Walmart showed approximately 2x higher impact and approximately 3x incremental ROAS compared to single-platform attribution views, which fundamentally changes how you should be valuing and allocating your media investment.
| Measurement approach | What it measures | Key limitation | Best used for |
|---|---|---|---|
| Traditional ROAS | Revenue attributed to ads | Overcounts baseline buyers | Quick campaign pacing checks |
| Multi-touch attribution | Customer touchpoints across journey | Still credits non-incremental touches | Funnel visualization |
| Incrementality testing | True lift above organic baseline | Requires holdout methodology | Budget allocation decisions |
| Cross-channel incrementality | Full-funnel lift including in-store | Data-intensive to implement | Strategic investment planning |
The implications for data strategies for brand expansion are significant. When you know which channels are driving true incremental buyers, you can reallocate from channels that look good on ROAS but are mostly capturing existing demand, and invest more aggressively in the channels that are actually expanding your customer base.
Important principles for implementing incrementality measurement:
-
Use holdout groups by suppressing ads for a defined geographic or audience segment to establish a true baseline
-
Run tests for a full purchase cycle to avoid seasonal noise distorting your lift calculation
-
Measure across channels simultaneously since single-channel tests miss cross-channel effects
-
Treat it as an ongoing agenda, not a one-time study, because customer behavior and media efficiency change over time
The cross-channel advertising attribution framework is the bridge between what you are spending and what you are actually growing.
Building your scalable data-driven brand growth playbook
This is where the mechanics come together into an executable strategy. Companies with fully centralized data see 44% revenue growth versus only 8% for those without, which makes data unification the highest-leverage investment a brand manager can make in 2026.
Follow this sequence to build the foundation:
-
Audit and connect your data sources. Map every marketplace, ad platform, and retail data stream you use. Identify manual exports and replace them with API connections where possible.
-
Define your core KPI set. Unit Session Percentage, true incremental ROAS, inventory sell-through velocity, and customer acquisition cost should anchor every reporting view.
-
Establish a consistent A/B testing cadence. Set up Amazon’s Manage Your Experiments for ongoing listing tests and document results in a shared learning repository.
-
Integrate Scintilla or equivalent retail data feeds. Connect Walmart operational signals to your media activation layer so campaign decisions respond to real-time retail conditions.
-
Adopt a cross-channel incrementality framework. Build holdout testing into your quarterly planning and use results to reallocate budget toward highest-lift channels.
-
Deploy AI and automation at the data routing layer. Reduce reporting latency from days to hours by automating aggregation and alerting for significant metric shifts.
Pro Tip: When you invest in listing optimization, anchor every creative decision to a measurable KPI. “Better images” is not a hypothesis. “New lifestyle images will increase Unit Session Percentage by 8% for the top ASIN in the outdoor category” is testable, measurable, and buildable.
For the SEO component of your listings, Amazon SEO best practices provide the keyword architecture that feeds qualified traffic into the conversion funnel you are optimizing with data.
Why focusing on your data foundation is the real growth multiplier
Here is the uncomfortable truth most agencies and vendor pitches skip: the gap between brands that scale and brands that stall is almost never the analytics tool they chose. The difference between scaling and stalling in data-driven marketing strategies is almost always the data foundation, not the analytics layer sitting on top of it.
We have seen brands with sophisticated AI-powered attribution platforms fail to improve performance meaningfully because the data feeding those platforms was still fragmented, delayed, or inconsistently labeled. The algorithm is only as good as what you pipe into it. Garbage in, confident-looking garbage out.
What actually moves the needle is the operational work most brands find unglamorous: building reliable API connections, standardizing taxonomy across channels, reducing data latency from 48 hours to near real-time, and establishing shared KPI definitions across your marketing, finance, and merchandising teams. This work does not produce a flashy demo. But it produces the feedback loop velocity that lets you run twice as many experiments and act on what you learn twice as fast.
The brands we see winning at data-driven brand growth are not necessarily the ones with the most sophisticated analytics. They are the ones who have done the patient, deliberate work of building a clean operational data layer first. Once that foundation exists, every tool on top of it performs dramatically better, from AI-powered bidding to personalized content decisions to real-time media reallocation.
Understanding how e-commerce data drives ROI comes back to this: the return is not in the dashboard. It is in the decisions the dashboard enables, and those decisions are only as fast and accurate as the data underneath them.
How Nectar helps brands scale profitably with data-driven marketing
Scaling on Amazon and Walmart requires more than good data. It requires the infrastructure, expertise, and testing discipline to act on it continuously.
Nectar is a fully managed e-commerce agency built specifically for mid-sized and enterprise brands who need to win on Amazon, Walmart, and Shopify through data, not guesswork. Our proprietary iDerive analytics platform unifies marketplace and retail data into a single model so your team sees the full picture without the manual reconciliation. From there, our specialists apply tested listing optimization frameworks, integrate Walmart’s Scintilla retail signals, and run ongoing incrementality measurement to make sure every media dollar is working harder. Explore our profitable brand growth services, or go deeper with our dedicated Amazon growth optimization and Walmart solutions to see how we drive measurable results for brands at your stage.
Frequently asked questions
What is a single source of truth (SSOT) and why is it important for scaling brands?
A SSOT unifies data from all marketplaces and retail channels into one consistent model, enabling reliable insights and faster decisions critical for scaling brand growth. Companies with a fully centralized SSOT report 44% revenue growth versus only 8% for those relying on fragmented data stacks.
How does Amazon’s Unit Session Percentage affect my listing optimization?
Unit Session Percentage is the primary conversion KPI to assess whether content changes are working, and tracking it before and after A+ Content updates is the most reliable way to confirm listing optimization effectiveness and isolate what is driving real improvement.
What advantage does Walmart’s Scintilla Media Data Feed provide for retailers?
It securely shares Walmart’s rich retail and operational data via APIs, enabling real-time, comprehensive media measurement and campaign optimization across partner platforms. Scintilla’s connectivity between retail performance signals and media decisions removes the manual data reconciliation that slows most teams down.
Why is incrementality measurement better than traditional ROAS for evaluating media?
Incrementality measurement isolates sales caused by advertising by excluding purchases that would have occurred organically, offering a fuller picture of true ad impact. Walmart incrementality data showed approximately 3x incremental ROAS compared to single-platform attribution views, meaning standard ROAS significantly understates or overstates true channel value depending on your mix.
How can I implement a scalable data-driven growth strategy?
Centralize your data into one platform, prioritize conversion-driven KPIs like Unit Session Percentage, integrate retail API feeds like Scintilla, adopt cross-channel incrementality measurement, and use AI-powered automation to reduce data latency and accelerate your decision cycles across all active channels.
Recommended
































































.webp)