TL;DR:
- Marketplace insights are a continuous operation that helps brands connect external market signals to their business decisions. They involve monitoring sales, pricing, and customer feedback to anticipate shifts and optimize strategies quickly. Using targeted KPIs, third-party data, and integrated systems builds a competitive advantage that reactive, periodic reporting cannot achieve.
Marketplace insights are the continuous intelligence function that e-commerce brands use to translate complex external market data into clear decisions that drive growth and profitability. For mid-market and enterprise brands competing across Amazon, Walmart, and Shopify, the role of marketplace insights goes far beyond pulling monthly reports. It means closing the gap between what your internal KPIs tell you and what the market is actually doing. Brands with unified marketplace analytics dashboards save 5–10 hours weekly and avoid stockouts costing over $50,000 annually. That kind of operational advantage does not come from one-off research projects. It comes from treating market intelligence as an ongoing function.
What are marketplace insights and how do they differ from traditional market research?
Marketplace insights are defined as the continuous monitoring, interpretation, and application of market signals to guide business decisions. Traditional market research is a project. Marketplace intelligence is a function, and that distinction changes everything about how you staff it, fund it, and use it.
Classic market research delivers a snapshot. A brand commissions a study, receives a report, and acts on findings that may already be months old by the time decisions get made. Marketplace insights, by contrast, close strategic blind spots between internal KPIs and the external forces reshaping demand in real time. The intelligence is always current because the monitoring never stops.
The data sources involved are also fundamentally different. Traditional research relies on surveys, focus groups, and syndicated reports. Marketplace intelligence pulls from:
-
Sales velocity and rank changes across channels
-
Pricing movements from competing listings
-
Search volume trends and keyword shifts
-
Customer review sentiment and complaint themes
-
Inventory availability signals from the broader category
Interpretation is what separates raw data from actual insight. A spike in search volume for a keyword your listing does not target is just a number until someone connects it to a product gap you can fill. That interpretive layer, combining quantitative signals with qualitative buyer feedback, is what creates a fuller picture of unmet needs and strategic opportunities. Enterprise brands that treat this function like finance or operations, with dedicated ownership and regular cadence, consistently outperform those that treat it as a quarterly task.
Which data sources and KPIs drive effective marketplace insights?
The most powerful marketplace insights combine two categories of signal. The first is hard data: sales volumes, search rank, price elasticity, and inventory health. The second is buyer language: the words customers use in reviews, the complaints they repeat, and the praise that reveals what they actually value. Numbers alone miss the story. Buyer language fills in the why.
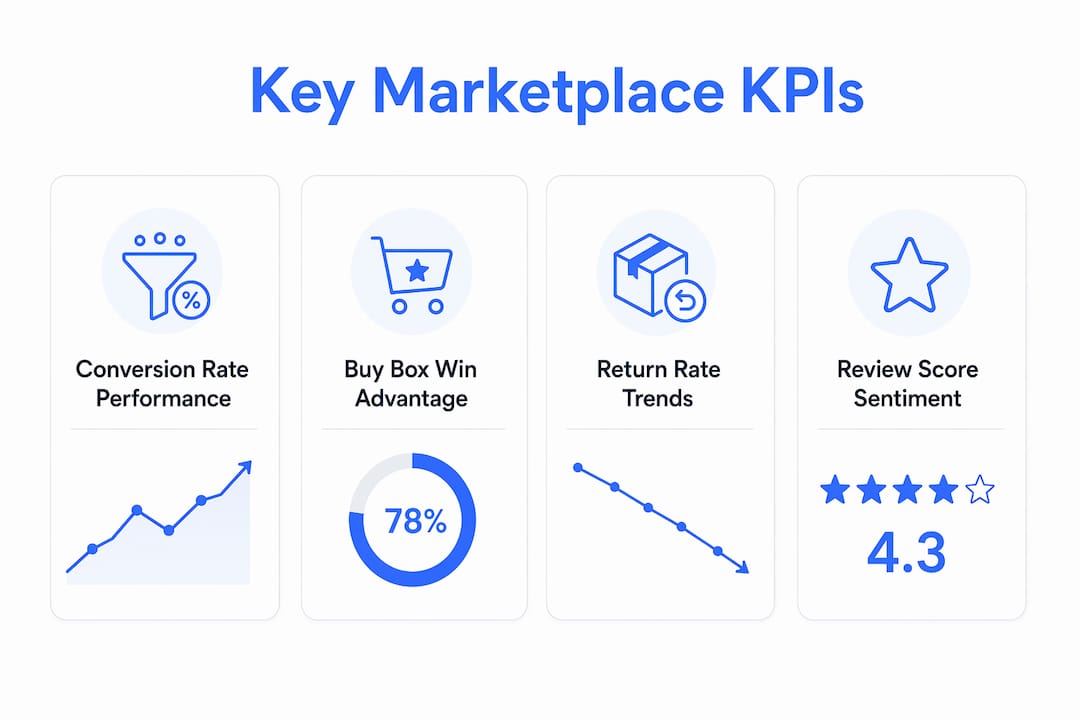
Effective brands track 15–20 specific KPIs that function as early-warning signals for supply or demand problems. That number is deliberate. Too few KPIs and you miss emerging issues. Too many and the signal gets buried in noise. The right set depends on your category, but a strong core includes:
-
Conversion rate by listing and channel
-
Buy Box win rate and price position relative to category average
-
Return rate and return reason codes
-
Review velocity and average rating trend
-
Inventory days on hand versus category sell-through rate
-
Advertising cost of sale (ACoS) and total ACoS
-
Organic rank for top-10 category keywords
Each of these KPIs tells a different part of the same story. A rising return rate paired with a drop in review scores, for example, signals a product quality or listing accuracy problem before it becomes a suppression event.
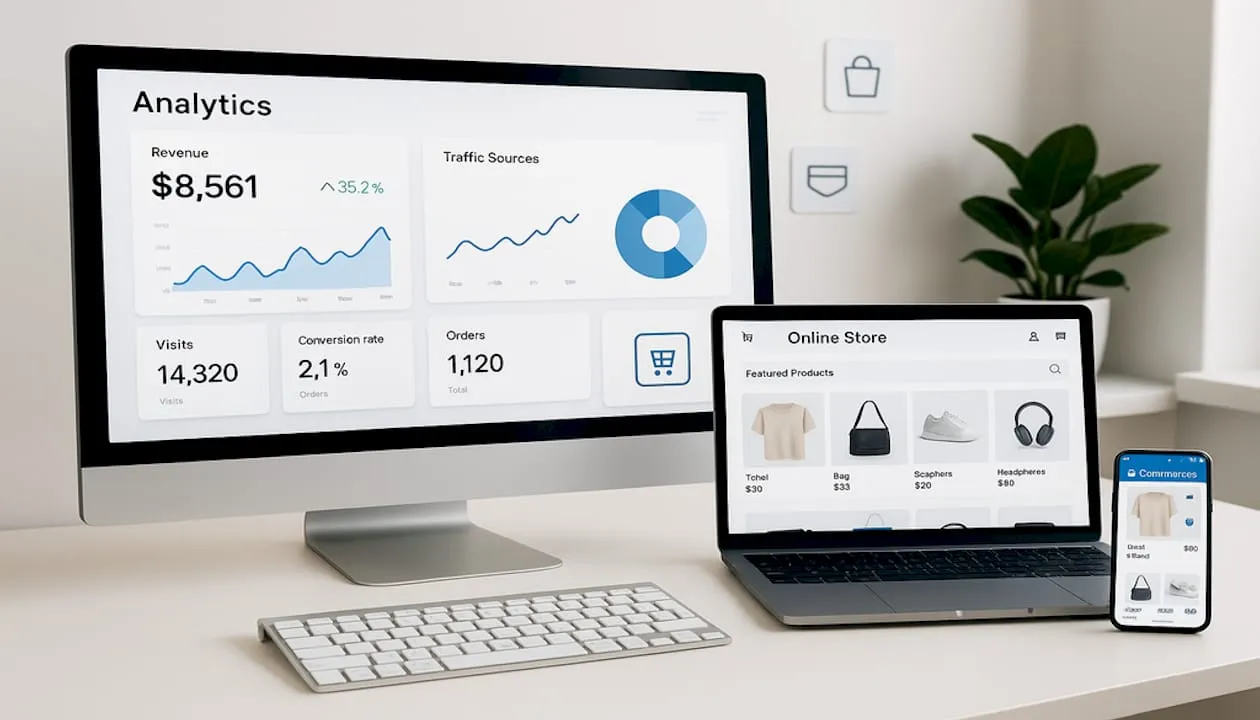
Unified dashboards that connect marketplace sales data with operational systems like NetSuite or Odoo provide context that standalone analytics tools cannot. ERP-based dashboards link sales performance to inventory levels and accounting data, so you can see whether a revenue dip reflects a demand problem or a fulfillment constraint. That distinction drives completely different responses.

Pro Tip: Audit your current KPI set and remove any metric that does not connect directly to a decision. If a number cannot tell you to do something different, it is a vanity metric. Focus your dashboard on the KPIs that drive growth and cut the rest.
How do marketplace insights help brands anticipate market shifts?
Real-time marketplace intelligence enables brands to respond to pricing or demand shifts within the same business hour. That is a structural advantage in fast-moving categories where a competitor’s price drop or a viral review can reshape demand overnight. Brands that wait for weekly or monthly reports are always playing catch-up.
Anticipatory decision-making works through a specific sequence:
-
Monitor continuously. Set alerts for rank changes, price movements, and review volume spikes in your category. Do not wait for a scheduled report to surface a problem.
-
Detect gaps through review analysis. When competing products consistently receive complaints about a specific feature, that is a product development signal. Brands that read competitor reviews as market research find bundling and differentiation opportunities before they show up in sales data.
-
Defend market share with pricing intelligence. Track competitor price changes in near real time. A competitor dropping price by 15% in a high-velocity period like Q4 requires a same-day response, not a next-week one.
-
Align inventory to demand signals. Search volume trends for seasonal or trending keywords predict demand spikes before they hit your sales data. Brands that act on these signals avoid the stockouts that cost mid-sized sellers over $50,000 annually.
-
Adjust advertising based on category dynamics. When organic rank drops for a core keyword, paid support should increase immediately. Waiting for the next campaign review cycle means losing ground that takes weeks to recover.
The brands that execute this sequence consistently are not reacting to the market. They are shaping their position within it. Nectar’s proprietary iDerive analytics platform is built specifically to surface these signals for brands operating across Amazon, Walmart, and Shopify, so the intelligence reaches the right person at the right time.
Pro Tip: Use marketplace trend monitoring to set category-level benchmarks. When your metrics diverge from category trends, that divergence is the signal worth investigating, not the absolute number.
What are best practices for integrating marketplace insights into enterprise operations?
Embedding marketplace intelligence into daily operations requires more than a good dashboard. It requires clear data ownership, cross-channel aggregation, and a review cadence that matches the speed of your market.
The most effective integration frameworks share several characteristics:
-
Unified data architecture. Aggregate data from every channel into a single source of truth. Brands selling across Amazon, Walmart, and Shopify need to see cross-channel performance together to detect cannibalization and identify which channel drives the highest lifetime value.
-
Clear data ownership. Assign a named owner to each KPI category. Without ownership, data governance breaks down and teams make decisions from different versions of the same metric.
-
Third-party data inclusion. Platform-native analytics have a structural limitation. Platforms often restrict analytics scope to encourage higher seller prices and commissions. Third-party data sources provide the unbiased competitive view that native tools cannot.
-
Operational integration. Connect marketplace data to your ERP, CRM, and advertising platforms. Siloed data produces siloed decisions. A connected operating model that links data, CRM, and monetization produces decisions that account for the full business impact.
-
Regular review cadence. Weekly reviews for operational KPIs, monthly reviews for strategic trends, and quarterly reviews for resource allocation. Each cadence serves a different decision type.
“Data quality is now a core revenue strategy. Moving away from vanity metrics ensures focus on KPIs that drive measurable growth outcomes.” — Marketplace Growth Strategy research
The resource allocation frameworks that work best at enterprise scale are built on this kind of integrated intelligence. When you know which channels, categories, and products generate the highest return, you can direct budget and attention with confidence rather than intuition.
What common pitfalls undermine the value of marketplace insights?
Most brands that struggle with marketplace analytics are not failing because of bad data. They are failing because of how they use it. The pitfalls are predictable and avoidable.
-
Relying solely on platform-native analytics. Amazon Seller Central and Walmart Seller Center provide useful data, but both platforms design their analytics filters in ways that can obscure competitive dynamics. Brands that never look beyond native tools miss the real-world pricing and demand signals that third-party sources surface.
-
Tracking vanity metrics. Page views, impressions, and follower counts feel like progress. They rarely connect to revenue. Data quality as a revenue strategy means replacing these metrics with conversion rate, ACoS, and return rate, which actually predict business outcomes.
-
Ignoring buyer language. Review sentiment is one of the most underused data sources in enterprise e-commerce. Brands that read reviews only for star ratings miss the specific language customers use to describe unmet needs, which is exactly the language that should appear in your listings and product development roadmap.
-
Fragmented data silos. When the advertising team, the inventory team, and the finance team each work from different data exports, decisions conflict. A unified marketplace analytics investment eliminates this problem by giving every team the same numbers.
-
Reactive rather than continuous interpretation. Checking data only when something goes wrong is the most expensive habit in e-commerce. By the time a problem is visible in monthly reports, it has already cost you rank, reviews, and revenue.
Key takeaways
Marketplace insights function as a continuous intelligence operation, not a periodic reporting task, and brands that treat them that way consistently outperform those that do not.
Point: Continuous intelligence Marketplace insights work as an ongoing function, not a one-time project. Brands that monitor continuously respond faster and lose less ground.
Point: Hard signals plus buyer language Combining sales data with review sentiment exposes gaps and opportunities that numbers alone cannot reveal.
Point: 15–20 focused KPIs Tracking a tight set of early-warning KPIs prevents both information overload and blind spots in supply and demand management.
Point: Third-party data is non-negotiable Platform-native analytics have structural limits. Unbiased competitive intelligence requires external data sources.
Point: Unified data architecture Connecting marketplace data to ERP, CRM, and advertising systems eliminates silos and produces decisions that account for the full business impact.
The strategic moat most brands are not building
I have worked with enough mid-market and enterprise brands to recognize a pattern. The ones that grow consistently are not necessarily the ones with the best products or the biggest ad budgets. They are the ones that have built marketplace intelligence into how they operate every day, not just how they plan every quarter.
The uncomfortable truth is that most brands treat marketplace data as a reporting function. Someone pulls numbers, puts them in a deck, and presents them at a monthly meeting. By the time decisions get made, the market has already moved. The brands winning in 2026 treat intelligence the same way they treat finance. It is always on, always owned, and always connected to a decision.
What I find most undervalued is the combination of quantitative data with qualitative buyer feedback. A brand can have a perfect dashboard and still miss the fact that customers keep mentioning a packaging problem in reviews. That signal, if acted on, could reduce returns by a meaningful margin and improve ratings enough to lift organic rank. The data is there. The discipline to read it is what separates good operators from great ones.
The other thing I would push back on is the idea that you need a massive analytics team to do this well. What you need is clear ownership, the right KPIs, and a cadence that matches your market’s speed. The role of data in scaling brands is not about having more information. It is about having the right information reach the right person at the right moment.
Build that, and marketplace intelligence becomes a competitive moat. Ignore it, and you are always reacting to a market that your competitors are already shaping.
— Dan Katona
How Nectar turns marketplace data into profitable growth
Brands that want to move from reactive reporting to continuous intelligence need more than a better dashboard. They need a partner who understands how to connect data to decisions across every channel.

Nectar’s fully managed e-commerce services combine the iDerive analytics platform with full-funnel management across Amazon, Walmart, and Shopify. The result is a unified view of your marketplace performance, tied directly to advertising, inventory, and creative decisions. Whether you are defending market share in a competitive category or scaling into new channels, Nectar’s brand growth services give you the intelligence and execution capacity to grow profitably. See what a data-driven approach looks like for your brand.
FAQ
What is the role of marketplace insights in e-commerce?
Marketplace insights function as a continuous intelligence operation that connects external market signals to internal business decisions. Brands use them to anticipate demand shifts, defend market share, and allocate resources based on real data rather than intuition.
How do marketplace insights differ from traditional market research?
Traditional market research is a one-time project that delivers a static report. Marketplace insights are an ongoing function that monitors sales, pricing, search behavior, and buyer sentiment continuously to support faster, more accurate decisions.
Which KPIs matter most for marketplace analytics?
The most effective brands track 15–20 KPIs including conversion rate, Buy Box win rate, ACoS, return rate, and organic rank for core keywords. These metrics act as early-warning signals for supply or demand problems before they affect revenue.
Why should brands use third-party data alongside platform analytics?
Platform-native analytics can restrict the competitive view to encourage higher seller prices and commissions. Third-party data sources provide unbiased signals about real-world pricing, demand, and competitor behavior that native tools do not surface.
How often should brands review their marketplace data?
Operational KPIs warrant weekly review, category trends warrant monthly review, and resource allocation decisions warrant quarterly review. Each cadence matches a different type of decision and prevents both overreaction and delayed response.
Recommended




































































.webp)