Role of Merchandising Analytics in Driving Sales
.png)
TL;DR:
- Merchandising analytics uses data and advanced analysis to optimize product placement, pricing, and inventory decisions. It transforms raw data into real-time insights that inform proactive strategies for improved sales performance and margin growth. Successful implementation requires embedding analytics into workflows and leveraging AI to support decision-making rather than replacing human judgment.
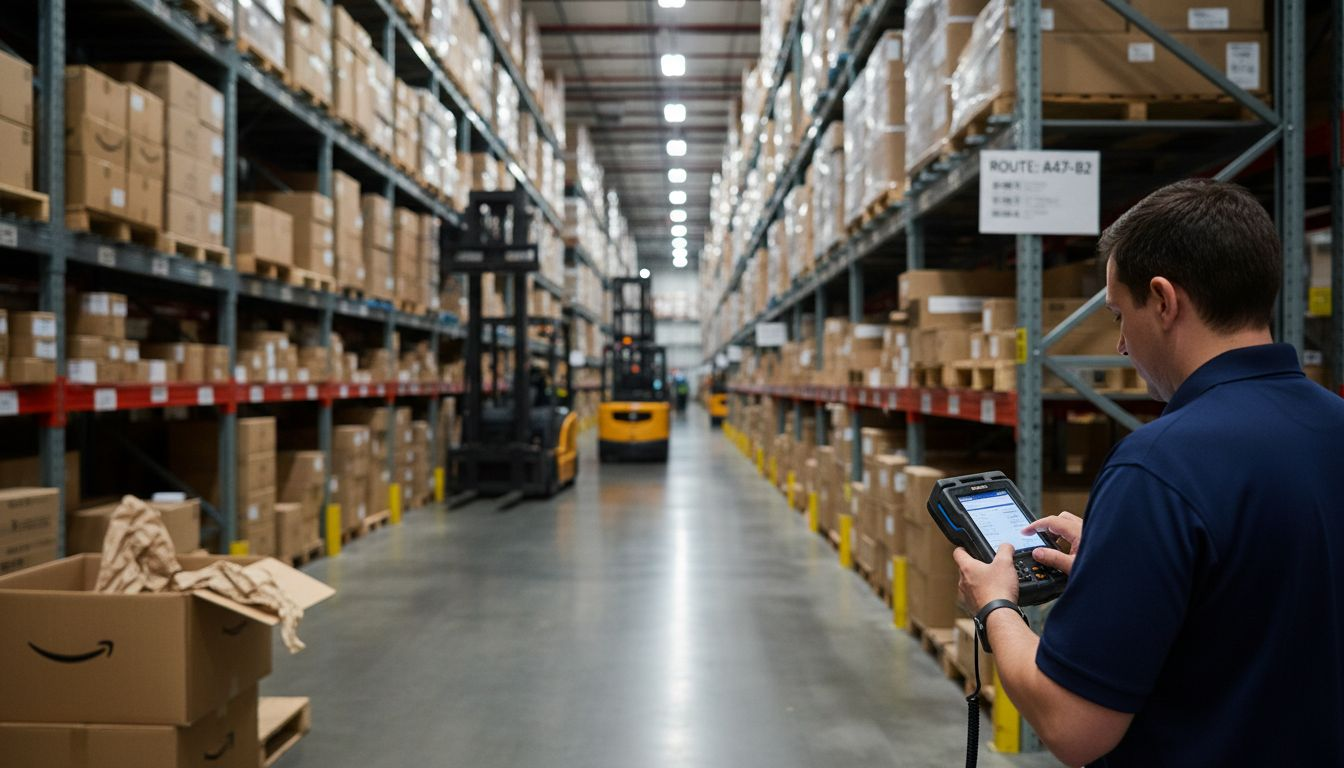
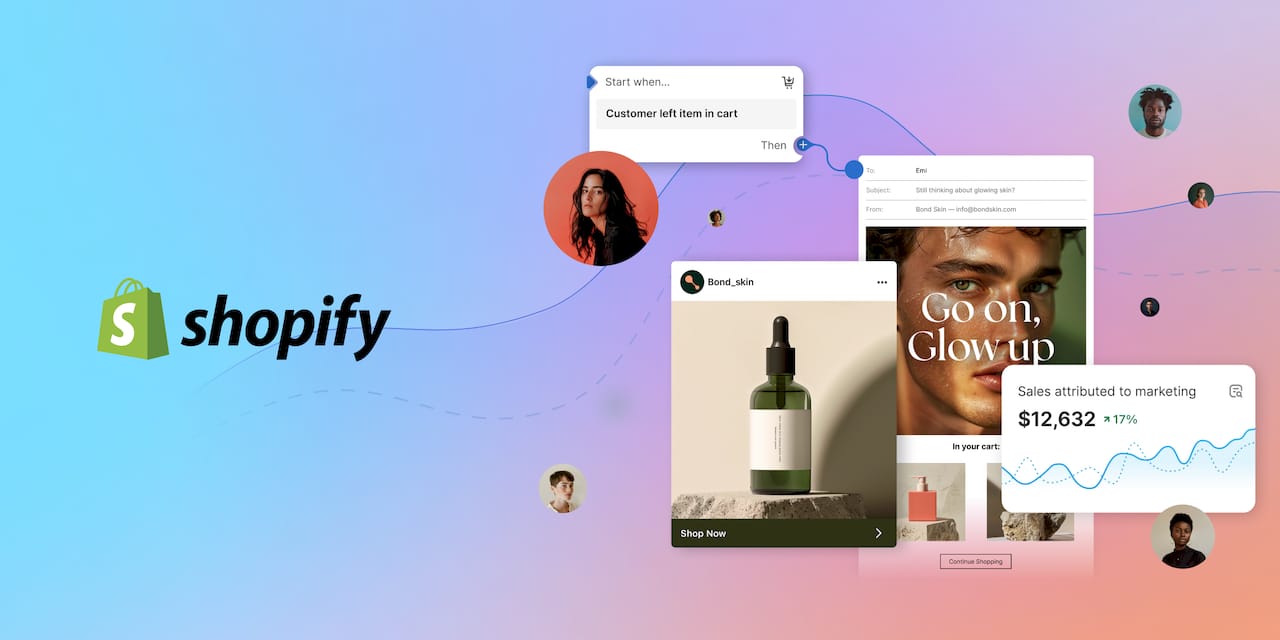
Merchandising analytics is the systematic use of data and advanced analysis to optimize product placement, pricing, promotions, and inventory decisions across retail and ecommerce platforms. The role of merchandising analytics has expanded far beyond tracking past sales. Today it connects real-time inventory signals, customer behavior, and competitive pricing into a single decision engine that tells you what to change, when to change it, and what the financial impact will be. Platforms like Nectar’s iDerive, NIQ, and Databricks have made this level of intelligence accessible to mid-sized and enterprise brands operating on Amazon, Walmart, and Shopify.
What is the role of merchandising analytics in ecommerce?
Merchandising analytics converts raw sales and inventory data into decisions. That single function separates high-performing catalogs from stagnant ones. Analytics tools integrate sales with inventory availability, customer demographics, and external context to predict outcomes and inform decisions. The implication is direct: you stop reacting to last month’s numbers and start shaping next week’s results.

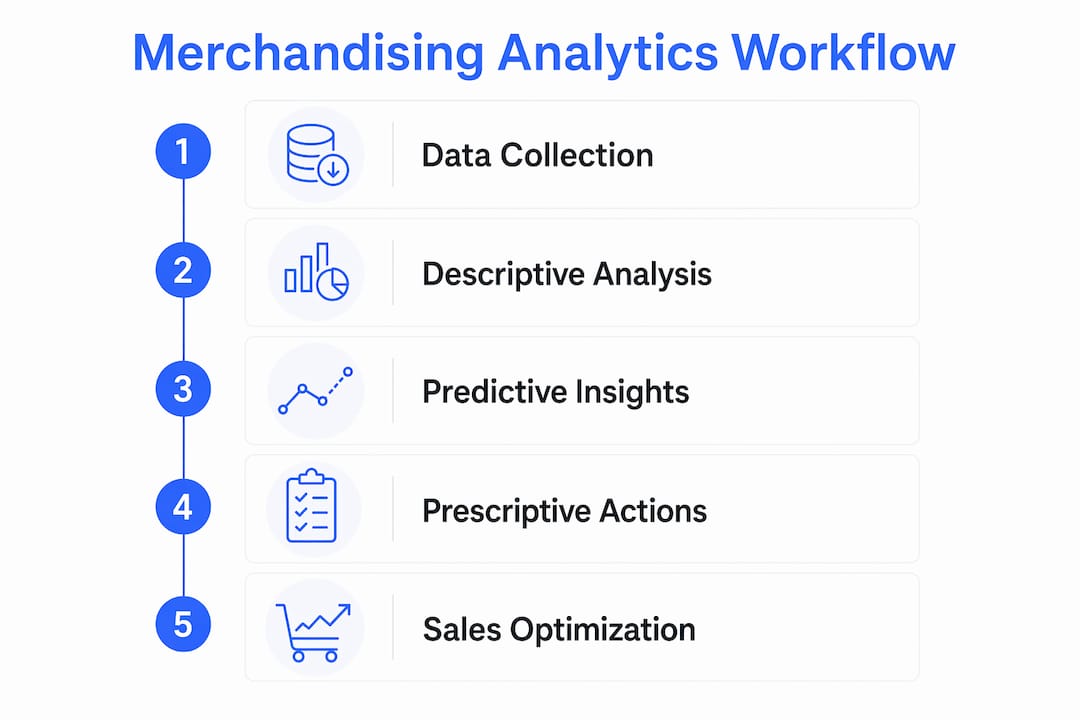
The discipline covers three levels of analysis. Descriptive analytics tells you what happened, such as which SKUs underperformed in Q1. Diagnostic analytics explains why, pointing to a pricing error or a stockout during a peak traffic window. Predictive analytics tells you what will happen if you hold price, cut inventory, or run a promotion next Tuesday. Most brands in 2026 are still stuck at the descriptive level. That gap is where margin gets lost.
Integrating external signals closes that gap. Weather data predicts demand shifts for seasonal categories. Competitor pricing feeds reveal when your price position has drifted. Customer demographic overlays show whether a conversion drop is a product problem or an audience mismatch. Analytics enhances merchandisers’ judgment by providing factual foundations and forward-looking insights, not by replacing human expertise. The human call still matters. The data just makes it faster and more accurate.
Pro Tip: Build your analytics stack in layers. Start with a clean descriptive baseline, then add diagnostic triggers before investing in predictive modeling. Skipping layers creates blind spots that expensive AI tools cannot fix.
How does merchandising analytics work in practice?
The practical value of merchandising data shows up fastest in three workflows: product placement, pricing correction, and promotional execution. Real-time actionable insights enable merchandising teams to fix issues while campaigns are still active, improving sales results. Waiting for a post-campaign report means the revenue is already gone.
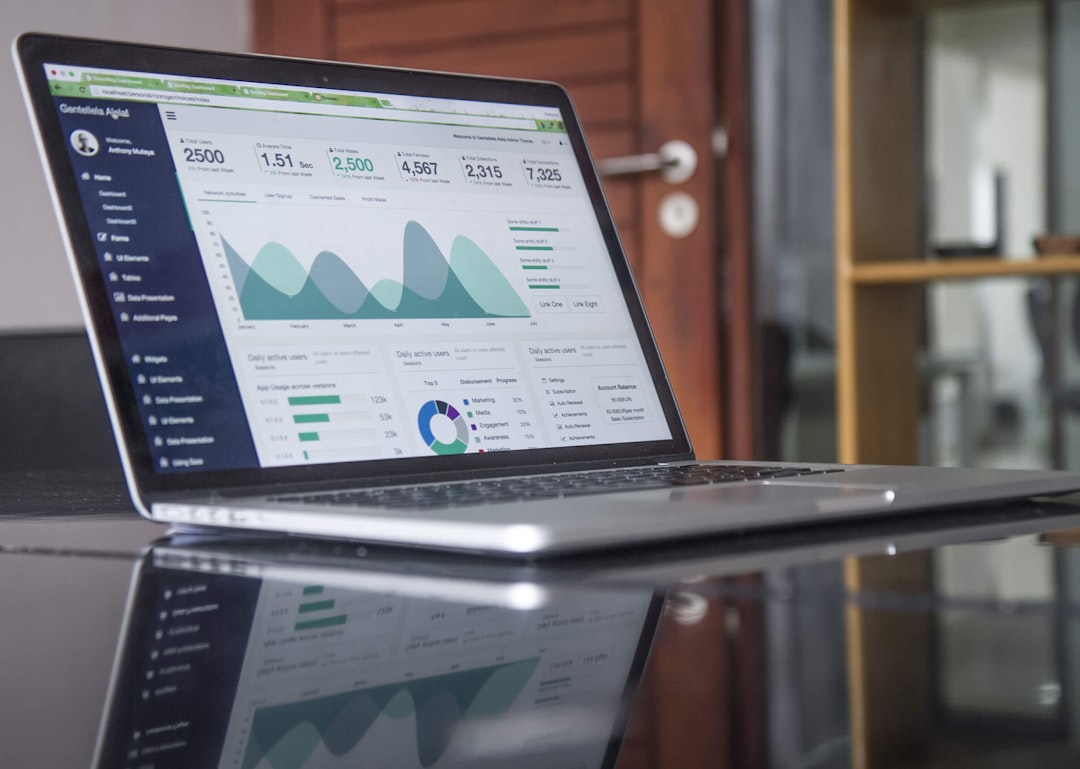
Modern ecommerce platforms embed performance signals directly inside the product grid. Dashboards that visualize KPIs within the grid shift analytics to merchandising intelligence, allowing proactive catalog optimization. A merchandiser can see a traffic spike on a listing, notice the conversion rate is flat, and trace it to a pricing error or a missing promotional badge without leaving the product management interface. That reduction in friction is the real productivity gain.
Here is where data-driven merchandising strategies create measurable lift across daily workflows:
-
Pricing errors caught in real time. A listing priced 12% above the Buy Box threshold on Amazon loses the featured placement automatically. Analytics flags this within hours, not weeks.
-
Promotional effectiveness tracked mid-campaign. If a coupon is driving clicks but not conversions, the issue is likely a content or pricing gap, not the promotion itself. Analytics separates the two.
-
Stockout prevention before it costs you rank. Weeks-of-supply metrics alert you when a fast-moving SKU is 10 days from going out of stock, giving fulfillment time to respond.
-
Assortment gaps identified by category. If a subcategory is generating search traffic but your catalog has no matching SKU, analytics surfaces that gap as a revenue opportunity.
-
Markdown timing optimized by demand curve. Instead of discounting at the end of a season out of panic, analytics shows the exact point where a moderate markdown maximizes total margin.
Embedding analytics within merchandisers’ workflows is critical to closing the gap between insights and action in ecommerce. Tools that require a separate login, a manual export, or a data team request will not get used consistently. The best merchandising analytics platforms live where the decisions get made.
Traditional reporting vs. ai-enabled merchandising platforms
The difference between traditional and AI-enabled merchandising analytics is not just speed. It is the nature of the output. Traditional reporting tells you what happened. AI-enabled platforms tell you what to do next.
The cost of manual reporting
Manual reporting consumes approximately 40% of merchandisers’ time on low-value tasks like data consolidation. That is two full days per week spent pulling numbers instead of acting on them. Spreadsheet-based workflows also introduce lag. By the time a weekly report is built and distributed, the promotional window it was meant to inform has already passed.
What ai-enabled platforms do differently
Agentic AI supports continuous learning systems that recommend merchandising actions under human oversight, improving efficiency. The merchandiser sets the guardrails. The AI handles the pattern recognition, scenario modeling, and alert generation. NIQ’s Price and Promo Optimizer, for example, simulates scenarios and quantifies trade-offs between volume, revenue, and margin before market launch, using elasticity modeling and store-level purchasing data. You test a price change virtually before it goes live. That is a fundamentally different risk profile than adjusting price and waiting to see what happens.
Databricks takes a similar approach to markdown timing. Combining inventory position, trend data, and competitive pricing signals produces markdown recommendations that improve margins compared to reactive approaches. The platform treats pricing, promotions, and inventory constraints as a coupled problem, not three separate spreadsheets.
Pro Tip: When evaluating AI-enabled merchandising platforms, ask vendors for validation data on their elasticity models. A model trained on category averages will underperform for niche SKUs with unusual demand curves. Insist on store-level or SKU-level validation.
Which merchandising kpis actually predict sales outcomes?
Tracking the right metrics before a campaign launches separates brands that catch problems early from those that absorb the cost of late markdowns and inventory mismatches. Merchandise planning KPIs such as planned sell-through, margin productivity, markdown exposure, and weeks of supply are used pre-allocation to evaluate plan health and avoid costly errors.
The following five metrics form the core of any merchandising performance framework:
-
Planned sell-through rate. This measures the percentage of inventory you expect to sell at full price within a defined window. A planned sell-through below 70% on a new product launch signals either an overstock position or weak demand forecasting.
-
Full-price sell-through rate. This tracks actual units sold at full price versus total units available. A gap between planned and actual full-price sell-through is the earliest warning sign of a markdown event ahead.
-
Margin productivity. This measures gross margin generated per unit of shelf space or catalog position. Low margin productivity on a high-traffic listing often points to a pricing or cost structure problem, not a traffic problem.
-
Markdown exposure. This quantifies the dollar value of inventory at risk of requiring a markdown to clear. High markdown exposure concentrated in a single category or season is a cash flow risk that analytics can surface weeks before it becomes a crisis.
-
Weeks of supply. This calculates how many weeks of current demand your on-hand inventory covers. Fewer than three weeks of supply on a fast-moving SKU during a peak period is a stockout risk. More than twelve weeks on a slow mover is a capital efficiency problem.
Early-warning metrics help retailers balance inventory breadth and depth and prevent last-minute markdowns and stock imbalances. The goal is not to monitor these numbers in isolation. The goal is to connect them so a shift in weeks of supply automatically triggers a review of markdown exposure and promotional calendar timing. That connection is what analytics-driven merch planning delivers. Coresight Research reports that 65% of retailers using Merchandise Financial Planning software improved financial performance, increasing gross sales by 6% on average and expanding margins by 1.1 percentage points. Those numbers reflect what happens when KPIs are connected to decisions, not just dashboards.
Key takeaways
Merchandising analytics drives measurable sales growth when it connects real-time data, predictive KPIs, and AI-enabled platforms into a single decision workflow rather than a reporting archive.
Descriptive vs. Predictive Analytics Most brands operate at the descriptive level. Moving to predictive and prescriptive analytics is where margin growth and risk reduction actually happen.
Workflow Integration Is Non-Negotiable Analytics tools that require manual exports or separate logins get ignored. Embedding insights directly in product grids closes the gap between data and action.
AI Reduces Low-Value Work Manual reporting consumes roughly 40% of a merchandiser’s time. AI-enabled platforms redirect that capacity toward decisions that affect revenue.
Five KPIs to Track Pre-Allocation Planned sell-through, full-price sell-through, margin productivity, markdown exposure, and weeks of supply are the metrics that predict plan health before problems become costly.
Connected Metrics Outperform Siloed Reports Retailers using connected Merchandise Financial Planning software report a 6% average increase in gross sales and a 1.1 percentage point margin expansion.
Why most brands are still getting merchandising analytics wrong
I have worked with enough brand managers to recognize a pattern. The analytics stack is in place. The dashboards look impressive. And yet the team is still making markdown decisions based on gut feel two weeks before end of season. The data exists. The connection to action does not.
The biggest failure in merchandising analytics is treating it as a reporting tool rather than a closed loop. A closed loop links KPI definition, data ingestion, action, and impact measurement. Most teams have the first two steps. Almost none have the last two built into their weekly workflow. That is not a technology problem. It is a process problem that technology alone will not solve.
The brands I have seen get this right share one habit. They review merchandising performance metrics in the same meeting where they make inventory and promotional decisions. Not in a separate analytics review. Not in a monthly business review. In the same room, at the same time, with the authority to act. That cadence is what turns ecommerce data visualization from a reporting exercise into a competitive advantage.
The AI conversation is real, but it is also overhyped in one specific way. Agentic AI does not fix a broken merchandising process. It accelerates whatever process you already have. If your process is reactive, AI makes you faster at reacting. If your process is proactive, AI makes you faster at preventing problems. The investment in AI tools should come after the investment in workflow design, not before.
— Dan Katona
How Nectar turns merchandising data into revenue
Nectar’s proprietary iDerive analytics platform unifies marketplace data from Amazon, Walmart, and Shopify into a single merchandising intelligence layer. Brand managers get real-time visibility into the performance metrics that matter, without the manual consolidation work that consumes most of a merchandiser’s week.

Nectar’s fully managed services connect that analytics layer directly to execution. Creative, advertising, and catalog optimization decisions are all informed by the same data set. That means pricing corrections, promotional adjustments, and inventory alerts translate into action within hours, not weeks. If you are ready to move from retrospective reports to a decision-driven merchandising workflow, explore Nectar’s full services to see how the platform supports profitable growth at scale.
FAQ
What is merchandising analytics?
Merchandising analytics is the practice of converting sales, inventory, pricing, and behavioral data into decisions that improve product placement, promotions, and inventory management. It covers descriptive, diagnostic, and predictive analysis across retail and ecommerce platforms.
How does merchandising analytics improve sales performance?
Analytics identifies pricing errors, stockout risks, and promotional inefficiencies while campaigns are still active, allowing teams to correct course before revenue is lost. Retailers using connected merchandise planning software report an average 6% increase in gross sales.
What are the most important merchandising kpis to track?
Planned sell-through, full-price sell-through, margin productivity, markdown exposure, and weeks of supply are the five metrics that most reliably predict plan health and flag risks before they become costly corrections.
How is AI changing the role of analytics in retail?
AI-enabled platforms automate data consolidation, simulate pricing and promotion scenarios, and surface recommendations under human oversight. Manual reporting currently consumes roughly 40% of a merchandiser’s time, and agentic AI redirects that capacity toward strategic decisions.
What is the difference between descriptive and predictive merchandising analytics?
Descriptive analytics reports what happened in past sales periods. Predictive analytics uses demand forecasts, inventory levels, and price elasticity models to recommend optimal timing and depth for pricing changes, promotions, and markdowns before they go to market.
Recommended