TL;DR:
- Listing optimization significantly boosts conversion rates without extra ad spend or traffic.
- Effective optimization involves enhancing titles, images, bullet points, content, and backend keywords.
- Regularly auditing and updating listings across Amazon, Walmart, and Shopify sustains long-term growth.
Most brands spending heavily on Amazon, Walmart, and Shopify ads share a frustrating blind spot: they pour budget into driving traffic, then lose those buyers on a listing that doesn’t convert. The math is unforgiving. Listing optimization improves conversion rates, delivering more sales from the same traffic without adding a dollar to your ad budget. For e-commerce managers at mid-sized and enterprise brands, this is the highest-leverage activity sitting right in front of you, and this guide walks through the evidence, the mechanics, and the exact levers that move the needle across every major marketplace.
Key Takeaways
| Point | Details |
|---|---|
| Higher conversions, same traffic | Optimized listings turn more browsers into buyers without extra ad spend. |
| Platform-specific wins | Tailor your optimizations for Amazon, Walmart, and Shopify to unlock their unique benefits. |
| Avoid costly pitfalls | Skipping basics like attribute completion or mobile-friendly design can invisibly suppress your listings. |
| ROI compounds over time | Once optimized, listings continue yielding returns long-term, scaling effortlessly across SKUs. |
What is listing optimization and why does it matter?
Listing optimization is the practice of systematically improving every element of a product page to increase the percentage of visitors who convert into buyers. That covers your title, bullet points, images, video, enhanced brand content, backend keywords, and product attributes. Each of those pieces either builds enough confidence for a shopper to click “Add to Cart,” or it doesn’t.
Here’s the number that changes how you should think about this. A 1% CVR boost on 10,000 visitors equals 100 additional orders, no extra inventory, no new ad spend, no additional traffic needed. Now multiply that across 50 SKUs in a catalog, and you start to understand why experienced operators treat listing optimization as a foundational growth lever rather than a cleanup task.
Contrast that with the alternative. Running more ads on an underoptimized listing does not fix conversion. It amplifies the leak. Every dollar spent sending traffic to a listing that converts at 4% when it could convert at 8% is effectively half-wasted. Optimization removes that inefficiency at scale.
Key components of a well-optimized listing:
- Title: Front-loaded with primary keywords, product type, and key differentiation
- Bullet points: Benefit-driven, addressing objections and reinforcing trust signals
- Main image and image stack: High-resolution, lifestyle-rich, and mobile-optimized
- A+ Content or Enhanced Brand Content: Storytelling, comparison modules, and feature callouts
- Backend keywords and attributes: Invisible to shoppers but critical for search discoverability
- Reviews and ratings: Social proof that validates the above and drives final purchase decisions
| Optimization activity | Avg. CVR impact | Effort to implement |
|---|---|---|
| Title rewrite with keyword research | +10 to 20% relative | Low |
| Image stack refresh | +15 to 25% relative | Medium |
| A+ Content addition | +20 to 40% relative | Medium |
| Bullet point rewrite | +5 to 15% relative | Low |
| Backend keyword optimization | Indirect (traffic lift) | Low |
Pro Tip: Don’t try to optimize your entire catalog at once. Identify your top 2 to 3 listings by traffic volume and lowest conversion rate, and fix those first. The ROI from those specific improvements will compound faster than any broad-sweep approach.
Our listing optimization checklist for Amazon, Walmart, and Shopify gives you the exact sequential framework for this approach.
Core components: Standing out and converting buyers
Now that you know what optimization involves, let’s see how each piece moves the needle for buyers and brands.

Buyer decisions on marketplace pages are made fast, often in under eight seconds. That makes the order and quality of information critical. A title that front-loads category keywords (“Stainless Steel Water Bottle 40oz Insulated”) beats one that front-loads brand name alone. It matches search intent immediately, which is what gets the click in the first place.
Images carry more weight than most brands expect. On mobile, which now accounts for the majority of marketplace shopping sessions, your main image and first two or three secondary images are what a buyer sees before deciding whether to read a word of copy. Lifestyle images that show the product in use trigger emotional connection. Infographic-style images that call out key specs satisfy the analytical buyer. Video, when present, has been shown to increase time-on-page and purchase intent meaningfully across all three major platforms. Brands that invest in creative services for listings consistently outperform competitors who treat product photography as an afterthought.
A+ Content deserves its own focus here. Amazon data shows that A+ Content increases conversions by up to 20 to 40% depending on category and brand equity. At the lower end, a 3 to 5% conversion lift on a high-volume ASIN is a meaningful revenue gain. At the higher end, for brands in competitive categories like home goods, beauty, or fitness, the impact is transformational. Premium A+ Content modules, available to brands enrolled in Amazon Brand Registry, allow for comparison charts, enhanced video, and multi-column storytelling layouts that basic listings simply cannot match.
Why buyers trust optimized listings:
- Complete attribute information reduces purchase anxiety and return rates
- High-quality images signal product quality before physical experience
- Clear, benefit-forward bullets answer the “what’s in it for me” question immediately
- Social proof through reviews confirms what the listing promises
- A+ Content gives the brand a chance to differentiate beyond price
| Listing element | Basic listing | Optimized listing |
|---|---|---|
| Title | Brand name + generic descriptor | Keyword-rich, benefit-focused, properly structured |
| Images | 1 to 3 plain product shots | 7 to 9 images: lifestyle, infographics, video |
| Bullets | Feature-list format | Benefit-led with objection handling |
| A+ Content | None or minimal | Full module with comparison, brand story, key use cases |
| Attributes | Partial | Complete, platform-specific fields filled |
For fashion and apparel categories, listing strategies specific to fashion e-commerce follow slightly different rules around sizing, material callouts, and lifestyle context, which is worth factoring into your creative brief.
Marketplace-specific factors: Amazon, Walmart, Shopify
With component basics established, it’s vital to understand how different platforms demand different optimization strategies.
Each marketplace has its own algorithm, its own content rules, and its own definition of a “complete” listing. What wins on Amazon does not automatically translate to Walmart or Shopify, and treating them the same is one of the most expensive mistakes brand managers make.
Amazon rewards conversion velocity above almost everything else. The algorithm surfaces ASINs that convert well and suppresses those that don’t, regardless of how much you spend on Sponsored Products. A+ Content, review volume, answered Q&As, and accurate backend attributes all feed the flywheel. Winning on Amazon means obsessing over every touchpoint that influences purchase decisions, from thumbnail click-through to post-conversion review solicitation.
Walmart has stricter attribute requirements than most brands realize. Walmart requires complete attributes, an ODR below 2%, and fast shipping to maintain Buy Box eligibility and search visibility. ODR, or Order Defect Rate, measures cancellations, late shipments, and returns as a percentage of total orders. If that metric creeps above 2%, listings get suppressed before you even realize it. Walmart’s search filters are also attribute-driven, meaning an incomplete size, color, or material field can literally hide your product from category browse.
For deeper guidance on Walmart marketplace best practices, understanding how Walmart’s algorithm scores listing quality is the first step.
Shopify is a different animal entirely. You own the storefront, which means you control the narrative completely. Optimization here is less about keyword algorithms and more about conversion rate optimization principles: page speed, above-the-fold layout, product photography quality, trust badges, review integration, and the storytelling arc of the product description. Brands on Shopify also have access to A/B testing tools that Amazon and Walmart don’t offer natively, which means you can test copy, images, and layouts directly against your own traffic.
| Platform | Primary optimization lever | Key metric to watch |
|---|---|---|
| Amazon | A+ Content, keywords, CVR | Conversion rate, BSR |
| Walmart | Attributes, ODR, pricing | Buy Box win rate |
| Shopify | Page layout, storytelling, speed | Session-to-purchase rate |
- Audit your Amazon listings for A+ Content gaps and backend keyword coverage quarterly
- Review Walmart attribute completeness every time you add or update a SKU
- Run Shopify conversion audits against mobile page speed and above-the-fold content monthly
- Monitor Buy Box optimization metrics across both Amazon and Walmart separately, since the winning criteria differ
Pro Tip: Platform content guidelines update more often than most teams realize. Set a calendar reminder to review each marketplace’s seller guidelines quarterly. Missing a new required attribute or violating an updated image policy can cost you ranking and Buy Box eligibility with zero warning.
Hidden pitfalls and advanced strategies
Beyond “best practices,” major results come from sidestepping common traps and leveraging high-leverage tactics that most competitors miss.
The most common mistake we see is keyword stuffing. It feels logical to pack every relevant search term into your title and bullets, but avoiding keyword stuffing, mobile truncation, and incomplete attributes is what separates listings that actually rank and convert from those that technically check compliance boxes but read like spam. Buyers are smart. A title that reads “Water Bottle Insulated Stainless Steel 40oz BPA Free Large Wide Mouth Travel Sports Gym Tumbler” is a red flag for quality, not a signal of relevance.
Most damaging listing mistakes to avoid:
- Keyword stuffing in titles and bullets: Destroys readability and signals low quality to both algorithms and buyers
- Ignoring mobile truncation: On Amazon, titles display roughly 80 characters on mobile. If your key differentiator appears in character 120, no mobile shopper will see it
- Missing or incomplete attribute fields: On Walmart especially, empty attributes remove your listing from filtered search results entirely
- Low-resolution or white-background-only images: Fails to build emotional connection or answer the “what does this look like in real life” question
- Neglecting review recency: An older listing with reviews from three years ago signals stale inventory to algorithm and buyer alike
“Front-load your most important keywords in your title. Complete every Walmart attribute field, including ones that seem optional. These two steps alone can dramatically unlock filter visibility and search placement.”
The advanced play here is to prioritize your optimization effort by traffic and gap. Pull your analytics and find the SKUs with high impressions but below-average conversion. Those are your hidden money listings. They already have traffic, they just can’t close. Fixing the listing on those specific ASINs or items delivers the fastest measurable ROI because you’re not waiting to build traffic from scratch.
For Amazon-specific tactics, our guide on how to boost Amazon conversion rates goes deeper on the creative and copy frameworks that work in competitive categories.
For Walmart-specific improvements, the Walmart optimization tips for brands resource covers attribute strategy and suppression recovery in detail.
Pro Tip: Start with your highest-traffic, lowest-converting SKUs for the fastest ROI. A 2% CVR improvement on a listing driving 5,000 monthly visits outperforms a 5% improvement on a listing with 500 visits. Prioritize by volume first.
Why brands still overlook optimization—and the truth about lasting ROI
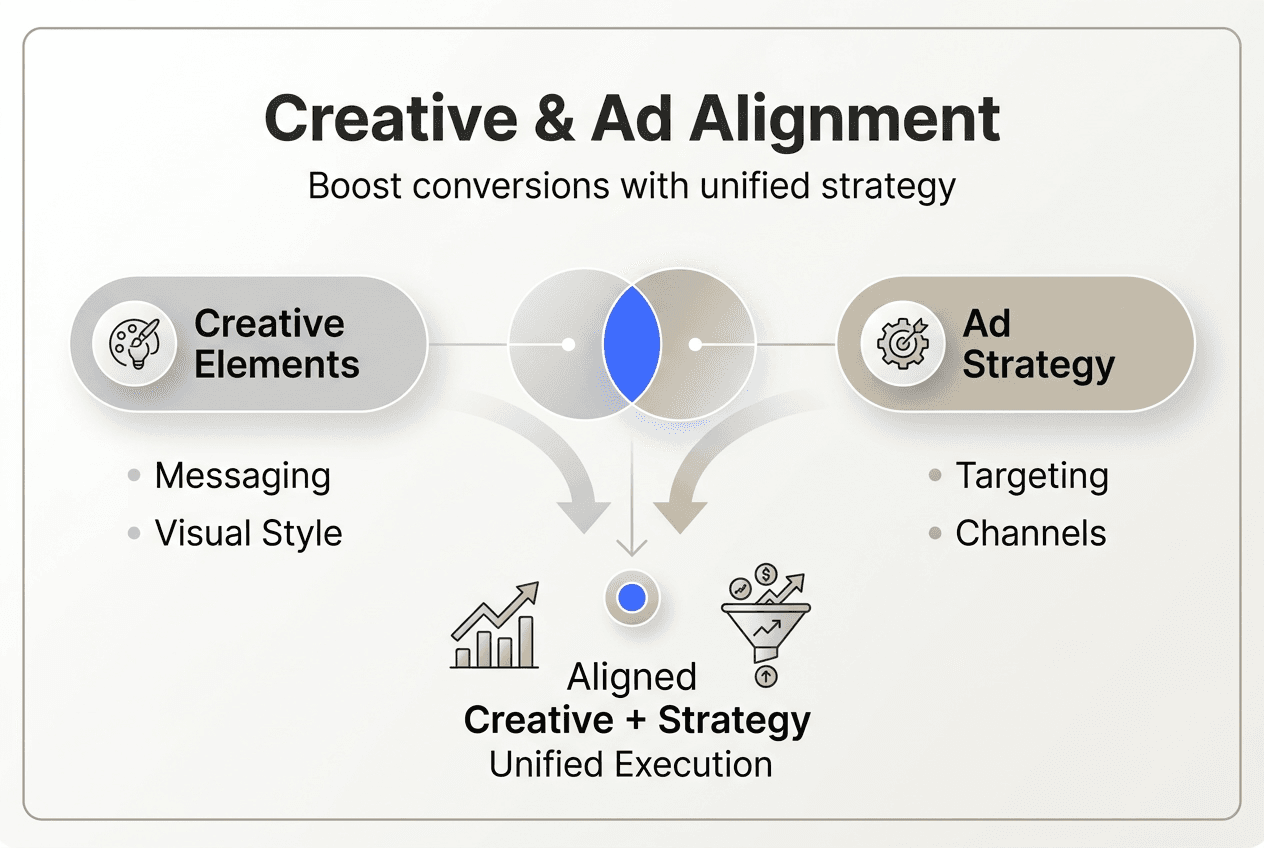
We see a consistent pattern across mid-sized and enterprise brands: the teams that know they need better listings still delay acting on it. The reasons are almost never strategic. They’re organizational. Someone owns ads. Someone else owns creative. The listing falls in between, and both teams assume the other will handle it.
This gap is expensive. Every week a listing runs at 6% conversion instead of 10% is revenue that cannot be recovered. Ads that ran during that window were partially wasted. Organic ranking that could have been higher based on conversion velocity was suppressed. The cost is invisible until you calculate it.
What makes this more frustrating is that paid advertising results are highly visible: you see spend, impressions, and ROAS in a dashboard every morning. Listing quality improvements are harder to isolate in reporting, which makes it easy to deprioritize. But the brands we see scaling most effectively on Amazon, Walmart, and Shopify treat listing optimization as a recurring operational process, not a one-time project.
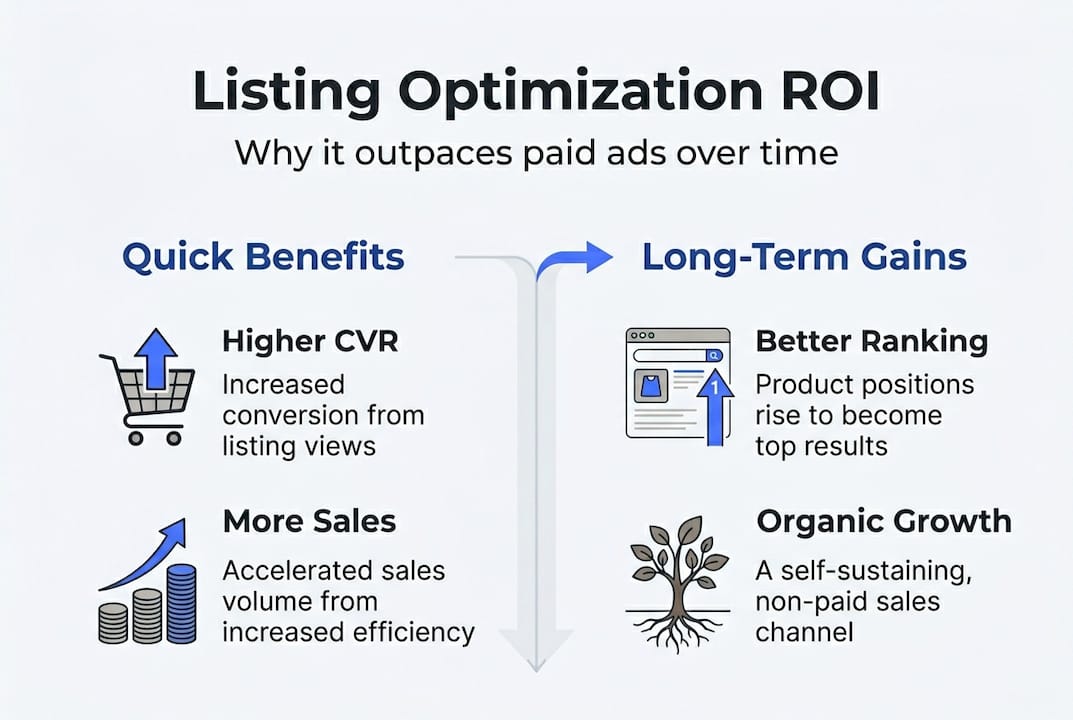
The compounding effect is real. An optimized listing generates better conversion data, which improves organic ranking, which brings more traffic, which generates more reviews, which improves conversion further. That flywheel does not exist for paid media. When you stop spending on ads, results stop. When you optimize a listing correctly, it earns for you indefinitely.
The uncomfortable truth is that most listing optimization is not technically complex. It’s a discipline problem. Brands that commit to quarterly audits, structured creative refreshes, and attribute maintenance consistently outperform those chasing the next ad format or promotional tactic. The evidence supporting long-term optimization results is clear: sustained listing quality is a durable competitive advantage that compounds in ways ad spend simply cannot replicate.
Ready to maximize your marketplace sales? We can help
For e-commerce managers ready to close the gap between traffic and revenue, expert optimization removes the organizational friction that keeps listings underperforming.
Nectar’s fully managed approach combines in-house photography, videography, and design with data-driven strategy powered by the iDerive analytics platform. Whether you’re scaling on Amazon, building out your Walmart presence, or accelerating on Shopify, Nectar identifies the exact listing gaps costing you conversion and fixes them with precision. You get compounding results without the internal bandwidth headache. If your listings are already generating traffic, there’s revenue waiting to be unlocked right now.
Frequently asked questions
How quickly can listing optimization boost sales?
Most brands see measurable sales and conversion improvements within 2 to 3 weeks when optimizations are applied to high-traffic listings. Results vary by category and competitive intensity, but high-traffic SKUs typically show impact fastest.
Is listing optimization really better ROI than paid ads?
Yes, because optimization increases sales from your current traffic without additional ad spend, which directly improves profit margins. Ads amplify results from an optimized listing, but they cannot substitute for one.
What are the most common listing optimization mistakes?
The most frequent errors include keyword stuffing and missing attributes that hide listings from filtered search, plus failing to front-load critical information for mobile shoppers where titles truncate early.
Does Walmart require different optimization than Amazon?
Yes. Walmart requires complete attributes and an Order Defect Rate below 2% for Buy Box eligibility and visibility, while Amazon’s algorithm weights conversion velocity and A+ Content quality more heavily.
How do I measure the impact of listing optimizations?
Track conversion rate and sales on a per-SKU basis before and after each optimization, keeping traffic volume consistent so you isolate the listing’s contribution rather than external factors like promotions or seasonality.
Recommended


%20(1).png)


.png)