TL;DR:
- Online shelf share measures a brand’s visibility on e-commerce platforms relative to competitors and is a key performance indicator. It reflects organic ranking, content quality, inventory, and paid placements, requiring regular monitoring and precise definition to guide strategic decisions. Improving shelf share involves optimizing SKU visibility, content, stock levels, and balancing paid and organic efforts for sustained growth.
Share of shelf online is defined as the percentage of digital shelf space your brand occupies within a product category on an e-commerce platform, relative to all competing products. The industry term for this concept is “digital share of shelf,” and it functions as a key performance indicator across retail media analytics and category management. Platforms like Instacart and frameworks from Inriver recognize it as a core measure of brand visibility. A 2025 study found that increasing share of shelf from 10% to 25% lifted combined ad and organic traffic by 40%. That single data point explains why e-commerce managers and brand strategists treat this metric as a growth lever, not just a reporting number.
What is share of shelf online and how is it measured?
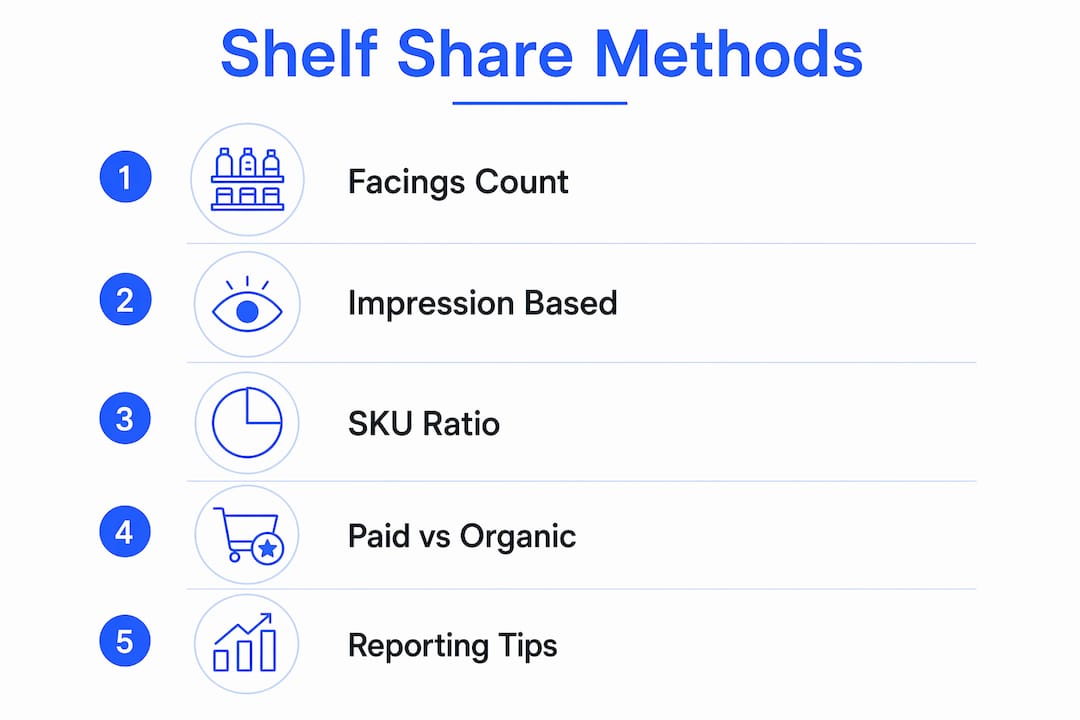
Digital share of shelf is not one single formula. Three distinct calculation methods exist, and choosing the right one depends on what you are trying to measure.
The facings count method measures the ratio of your brand’s product listings visible on a shelf page to the total number of listings shown. If 6 of 30 products on a category page belong to your brand, your facings share is 20%. This method mirrors traditional physical retail shelf measurement and works well for category page audits.
The impression-based method is the approach Instacart uses: brand impressions divided by total category impressions on the platform. This captures actual consumer exposure, not just listing presence. A product that appears in a high-traffic search result generates more impressions than one buried on page three, so this method reflects real visibility more accurately.
The SKU count ratio method is the simplest approach. Inriver defines it as your brand’s SKU count divided by the total SKU count in the category. It answers the question: “How much of this category does my brand represent?” It is useful for assortment planning but does not account for where those SKUs appear in search results.
One critical distinction separates paid shelf presence from organic shelf presence. Paid placements come from sponsored ad campaigns. Organic placements come from search ranking, content quality, and availability. Some platforms report these separately; others combine them. Knowing which type your dashboard reports changes how you interpret the number entirely.
Pro Tip: Before sharing shelf share data across teams, define in your reporting template whether the figure includes paid placements, organic placements, or both. Mixing paid and organic shelf presence without labeling them is the most common source of cross-team reporting errors.
Why does shelf share matter for e-commerce brand strategy?
Digital share of shelf is a visibility metric that reflects your brand’s full merchandising strength, not just your ad budget. Shelf share captures organic search ranking, content quality, and stock availability alongside paid placements. That means a brand with strong content and reliable inventory can hold meaningful shelf share even with a modest ad spend.
“Increasing Share of Shelf from 10% to 25% increased combined ad and organic traffic by 40%. That kind of lift does not come from ad spend alone. It comes from owning more of the category page, which drives both paid and organic clicks simultaneously.”
The commercial implication is direct. More shelf space means more consumer touchpoints. More touchpoints mean more purchase opportunities. Brands that track shelf share alongside share of search gain a clearer picture of where they are discoverable and where they are invisible. That combination guides smarter budget allocation decisions.
Shelf share also shapes category management. If your brand holds 8% of a category’s digital shelf while your nearest rival holds 22%, that gap tells you something specific: you are either under-assorted, under-ranked, or under-invested in content and availability. Each cause has a different fix. Without the metric, you are guessing at the problem.

The importance of shelf share in e-commerce extends to advertising efficiency as well. Brands with higher organic shelf presence get more return from each paid placement because their products appear in more contexts. Paid and organic shelf presence compound each other when both are managed deliberately.
What nuances and challenges exist when analyzing online shelf share data?
Shelf share data is more fragile than it looks. Several factors can distort the number and lead to wrong conclusions if you do not account for them.
-
Ad spend changes move shelf share fast. Shelf share shifts can occur within days to weeks after a sponsored campaign budget changes. A competitor doubling their ad spend on Monday can visibly reduce your shelf share by Wednesday. This makes shelf share a reactive metric that requires frequent monitoring, not monthly reviews.
-
Stock-outs create false negatives. When a product goes out of stock, it disappears from search results and category pages. Your shelf share drops, but the cause is a supply chain issue, not a competitive loss. Normalizing shelf share data by in-stock availability rate prevents you from misreading a logistics problem as a market share problem.
-
Seasonality distorts category totals. During peak seasons, categories expand as more sellers enter. Your absolute SKU count may stay the same while your percentage share falls. Always compare shelf share to the same period in prior years, not just the prior month.
-
Metric definitions vary by platform. What Instacart calls “category share of digital shelf” uses impression data. A different platform may use facings or SKU counts. Comparing shelf share numbers across platforms without aligning definitions produces meaningless data.
-
Cross-team misalignment multiplies errors. When the marketing team reports paid shelf share and the sales team reports combined shelf share, leadership sees two different numbers for the same brand. Defining shelf share explicitly in shared reporting templates is the fix.
Pro Tip: Build a single shelf share definition document that specifies the platform, the calculation method (impressions, facings, or SKU count), and whether paid and organic are included or separated. Distribute it to every team that touches the metric before the next reporting cycle.
How can e-commerce managers analyze and improve their digital shelf share?
Improving shelf share requires a structured approach that addresses every factor that affects your position on the digital shelf. The following framework covers the full picture.
Track SKU visibility first
Start by auditing which of your SKUs actually appear on category pages and in keyword search results. Digital shelves include keyword search results, category pages, and subcategory listings. A SKU that is listed but never appears in search results contributes nothing to your shelf share. Identify which products are invisible and why, whether due to poor content, low review counts, or pricing issues.
Monitor content compliance and organic ranking
Content quality directly affects organic shelf position. Product titles, bullet points, images, and A+ content all influence where your listing ranks. A well-built digital storefront with complete, accurate content consistently outranks thin listings. Run regular content audits against the platform’s content standards and fix gaps before investing more in paid placements.
Use integrated dashboards for real-time category data
Instacart’s analytics dashboards provide real-time category share impression metrics combining paid and organic placements. Use platform-native dashboards as your primary data source, then layer in third-party analytics tools for cross-platform views. The goal is a single view of your shelf share across all channels where your brand competes.
Balance paid and organic shelf investment
Paid campaigns can lift shelf share quickly, but that lift disappears the moment you cut the budget. Organic shelf share, built through content quality, review velocity, and inventory reliability, holds its position without continuous ad spend. The most durable shelf share strategies combine both. Use paid campaigns to defend key search terms while building organic ranking through content and fulfillment performance.
The following checklist covers the core levers for improving shelf share:
-
Audit SKU visibility across category pages and keyword search results
-
Fix content gaps: titles, images, bullet points, and enhanced content
-
Maintain in-stock rates above your category average
-
Run sponsored campaigns on high-value category keywords
-
Benchmark your shelf share against the category leader monthly
-
Align reporting definitions across marketing, sales, and category management teams
For a broader view of how market share growth connects to shelf share, tracking both metrics together reveals whether visibility gains are translating into actual revenue.
Key Takeaways
Digital share of shelf is a compound metric that reflects organic ranking, content quality, inventory availability, and paid placement together, and brands that manage all four factors consistently outperform those that treat it as a pure advertising metric.
| Point | Details |
|---|---|
| Define your metric precisely | Specify whether shelf share includes paid, organic, or combined placements before reporting to any team. |
| Monitor shelf share frequently | Shelf share can shift within days after ad spend changes, so weekly tracking is the minimum viable cadence. |
| Normalize for stock availability | Always adjust shelf share data for in-stock rate to avoid misreading supply chain issues as competitive losses. |
| Combine paid and organic levers | Sustainable shelf share requires both sponsored campaigns and strong organic content and inventory performance. |
| Benchmark against the category | Compare your shelf share to the category leader monthly to identify gaps and prioritize where to invest. |
The metric most brands are measuring wrong
I have worked with enough e-commerce teams to recognize a pattern: they pull their shelf share number, see it drop, and immediately increase ad spend. Sometimes that works. More often, the drop was caused by a stock-out or a content gap that no amount of paid budget will fix.
The uncomfortable truth about digital share of shelf is that it punishes brands that treat it as an advertising metric. If your organic ranking is weak because your product content is thin, you are paying to compensate for a problem you could solve for free. I have seen brands cut their sponsored ad spend by 30% after fixing content compliance issues and actually increase their shelf share, because their organic position improved enough to offset the paid reduction.
The other mistake I see constantly is measuring shelf share in isolation. Shelf share tells you how much of the category page you occupy. Share of search tells you how often consumers find you when they look for your category. Those two numbers together tell a complete story. Either one alone tells half a story, and half a story leads to half-right decisions.
Shelf share volatility is actually useful information if you read it correctly. A sudden drop in shelf share is an early warning signal, not a final verdict. It tells you something changed: a competitor increased spend, your inventory dipped, or a content issue pushed you down in organic rankings. The brands that respond to that signal within days, rather than waiting for the monthly report, are the ones that maintain category dominance over time.
— Dan Katona
How Nectar helps brands build lasting digital shelf presence
Shelf share gains require coordinated execution across advertising, content, and inventory. Nectar is a fully managed e-commerce agency that handles all three for brands on Amazon, Walmart, and Shopify.
Nectar’s Amazon growth services combine sponsored ads management with in-house creative production to build both paid and organic shelf presence simultaneously. The agency’s retail media capabilities extend to Walmart Connect advertising and Shopify site development, giving brands a unified approach to shelf share across every major platform. Powered by the proprietary iDerive analytics platform, Nectar gives brand managers the category-level data they need to act on shelf share shifts before they become competitive losses. If your brand’s digital shelf presence needs a structured growth plan, Nectar’s services are built for exactly that.
FAQ
What is the online shelf share definition?
Digital share of shelf is the percentage of a product category’s visible listings, impressions, or SKUs that belong to your brand on an e-commerce platform. It measures your brand’s visibility relative to all competing products in that category.
How do you calculate share of shelf online?
Three methods exist: the facings count ratio, the impression-based ratio used by platforms like Instacart, and the SKU count ratio defined by frameworks like Inriver. The impression-based method most accurately reflects actual consumer exposure.
What affects share of shelf online?
Organic search ranking, content quality, in-stock availability, and paid ad spend all affect shelf share. Shelf share is a holistic measure of merchandising strength, not just a function of advertising budget.
How often should you monitor digital shelf share?
Weekly monitoring is the minimum. Shelf share can shift within days after sponsored campaign budget changes, so monthly reviews miss the signals needed to respond quickly.
Should paid and organic shelf share be reported separately?
Yes. Combining paid and organic shelf share without labeling them creates reporting errors and cross-team misalignment. Define which type each report covers and document that definition in your reporting template.
Recommended










.png)