The highest-impact ROI maximization strategies share a common spine: measure incrementality first, reallocate budget toward channels that prove causal lift, run focused experiments on a repeatable cadence, and build the governance to act on what you learn. Every other tactic, creative refresh, bid optimization, landing page test, compounds on that foundation or wastes money without it.
Start this week:
-
Audit your current attribution model and flag channels where last-touch credit likely overstates contribution.
-
Identify one channel with enough volume to run a 20% holdout test within 30 days.
-
Pull your CLV:CAC ratio by acquisition channel. If you don’t have it, that gap is your first project.
Track these metrics immediately:
-
Incremental ROAS (not blended ROAS)
-
CLV:CAC ratio by channel
-
Marketing-sourced pipeline as a share of total revenue
Key Takeaways
The single most important shift in any ROI maximization program is moving from platform-reported attribution to incrementality-validated evidence before making budget decisions.
Point | Details
-
Measure incrementality first. Run at least one holdout test before scaling any channel; platform ROAS consistently overstates true contribution.
-
Use all four measurement methods. MMM, incrementality experiments, attribution, and customer insights each answer a different question; no single method is sufficient for portfolio decisions.
-
Reallocate in phases. Move budget in 10–15% increments over 4–6 weeks to avoid delivery disruption and isolate the reallocation effect.
-
70% people, 20% tech, 10% algorithms. BCG’s operating model ratio is a resource allocation guide: most measurement programs fail from governance gaps, not tool gaps.
-
Nectar’s iDerive platform. Nectar ties every spend decision to an incrementality estimate across Amazon, Walmart, and Shopify, replacing platform dashboards with auditable evidence.
How a four-legged measurement framework drives ROI maximization strategies
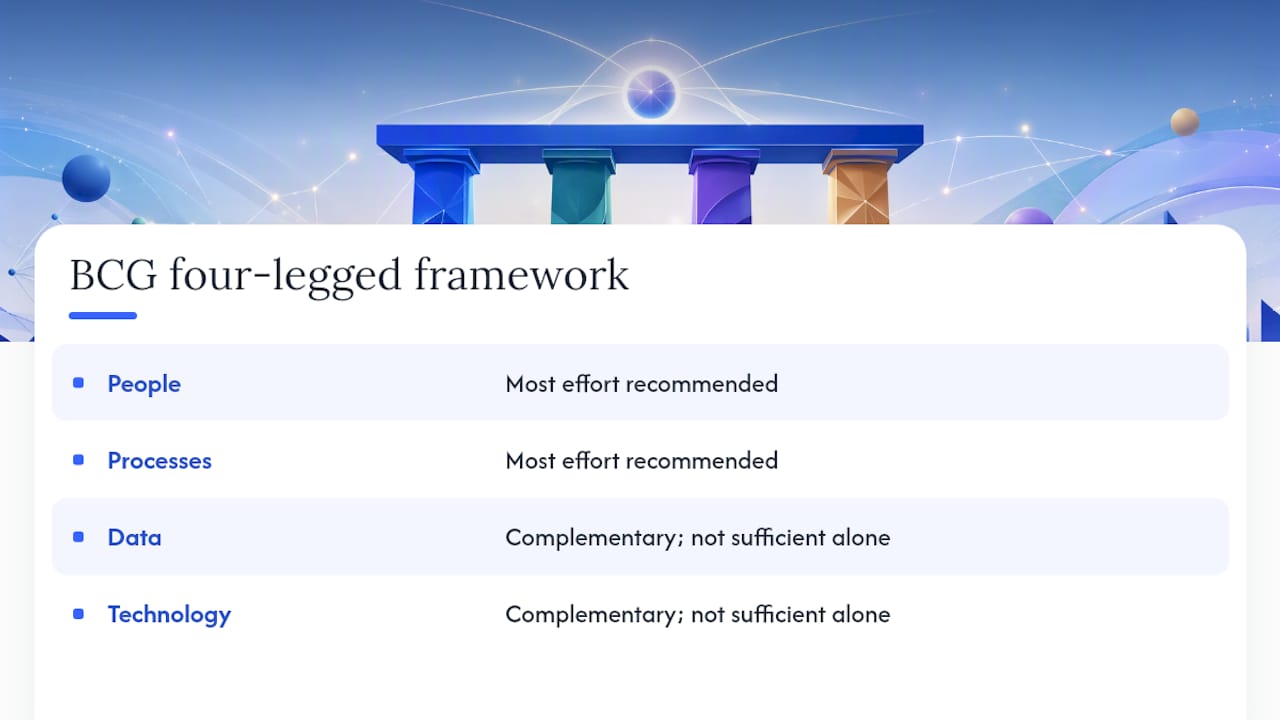
BCG’s four-legged measurement approach pairs four methods that each answer a different question and recommends dedicating most effort to people and processes. No single method gives you the full picture. Used together, they give finance and the C-suite something they can actually act on.
Marketing mix modeling (MMM)
MMM uses historical spend and sales data to estimate each channel’s contribution to revenue at a portfolio level. It captures long-term brand effects and offline channels that attribution tools miss entirely. The tradeoff: MMM is slow to update (typically quarterly) and can’t tell you whether a specific campaign in a specific market worked. Use it to set strategic budget ranges and to validate experiment results at scale.

Incrementality experiments
Randomized controlled tests and matched-market (geo) experiments are the gold standard for proving causal lift. IAB guidelines are direct on this: align the measurement method to the decision’s stakes. For a $2M channel reallocation, you want a geo holdout, not a last-click report. Experiments are precise but narrow: they answer one question at a time and require holding out revenue to generate clean data.
Data-driven attribution
Attribution models (linear, time-decay, data-driven) assign fractional credit across touchpoints in the path to conversion. They’re fast, granular, and useful for day-to-day bid and creative decisions. Their core weakness is that they measure correlation, not causation. A channel that appears in every converting path gets credit even when it contributed nothing incremental.
Customer insights and execution metrics
Surveys, brand lift studies, and first-party behavioral data fill the gaps that modeled methods miss. Execution metrics, things like impression share, quality score, and on-site conversion rate, tell you whether delivery is healthy before you interpret outcome data. Ipsos MMA describes incrementality as the net-new sales caused by marketing above a modeled baseline, and customer insights help you validate whether that baseline assumption is realistic.
Matching the method to the question:
-
Portfolio budget strategy (annual/quarterly): Use MMM as the primary input; calibrate with experiments.
-
Channel-level go/no-go decisions: Run a geo holdout or randomized test before committing significant spend.
-
Bid and creative optimization (weekly): Use attribution and execution metrics; treat them as directional, not causal.
-
Brand health and long-cycle effects: Supplement with brand lift surveys and CLV tracking.
-
Calibration loop: Run experiments quarterly to update MMM coefficients. MMM then tells you which channels deserve the next experiment.
Moving from attribution to allocation: how to reallocate budget toward incremental ROI
Most teams are over-indexed on attribution-reported winners and under-invested in channels that drive real incremental lift. The fix is a repeatable reallocation process, not a one-time budget shuffle.
-
Assess your baseline. Pull spend, attributed revenue, and blended ROAS by channel for the last 12 months. Flag any channel where you have no incrementality data at all. That’s where you’re flying blind.
-
Estimate incrementality by channel. For channels with existing experiment data, calculate incremental ROAS directly. For channels without it, use MMM coefficients as a proxy and mark them as “unvalidated.” Ad spend allocation for multi-channel e-commerce requires treating unvalidated channels differently from proven ones in your planning model.
-
Build response curves. Plot spend vs. incremental sales for each channel using MMM output or experiment data at multiple spend levels. Most channels show diminishing returns above a saturation point. Identify where each channel’s curve flattens, because that’s where you’re overspending.
-
Run pilot reallocation scenarios. Before moving budget, model three scenarios: hold flat, shift 10–15% from low-incremental channels to high-incremental ones, and shift 25%. Estimate the revenue impact of each using your response curves. Present the range to finance, not a single number.
-
Execute in phases and monitor. Move budget in 10–15% increments over 4–6 weeks. Watch delivery metrics (impression share, CPM) and conversion metrics simultaneously. A sudden drop in volume from a reallocated channel can create short-term revenue dips even when the long-term math is correct.
-
Lock in the new allocation and review quarterly. Once the pilot stabilizes, set the new baseline and schedule a quarterly review tied to your MMM refresh.
Pro Tip: Phase your reallocation over at least two budget periods. Moving too much spend at once disrupts delivery algorithms, inflates CPMs in the receiving channels, and makes it nearly impossible to separate reallocation effects from seasonal noise. Slow and staged is faster in the long run.
How to design, run, and interpret incrementality tests that finance will trust
About 52% of US brand and agency marketers now use incrementality testing, and the methodology has moved well past early adopter status. The gap between teams that do it well and teams that do it poorly is almost entirely in test design, not analysis.
Step-by-step test checklist:
-
Define the business question precisely. “Does our Amazon DSP spend drive incremental purchases, or are we paying to reach people who would have bought anyway?” is a testable question. “Is our marketing working?” is not.
-
Select the primary KPI. Incremental ROAS, incremental revenue, or incremental new-to-brand customers. Pick one before you start; adding KPIs after the test runs invites p-hacking.
-
Choose the method. Randomized holdout for digital channels with user-level targeting. Geo holdout (matched-market test) for channels without user-level control, including TV, out-of-home, and retail media. Synthetic control when you can’t find clean matched markets.
-
Size the holdout. A 20% holdout on a display campaign is a reasonable starting point for most mid-market budgets. For geo tests, match markets on pre-test sales trend, population, and category index. Run a power calculation: if your expected lift is 10% and your test group is too small, you’ll get an inconclusive result even if the lift is real.
-
Set the duration. IAB and eMarketer both recommend running tests for at least 3–4 weeks, longer for channels with longer purchase cycles. A two-week test on a product with a 45-day consideration window will understate lift.
-
Control for confounders. Avoid running tests during major promotional events (Prime Day, Black Friday) unless the promotion itself is what you’re testing. Flag any external events (competitor promotions, supply disruptions) that occurred during the test window.
-
Analyze and apply. Calculate incremental lift as the difference between test and holdout group outcomes, adjusted for pre-test baseline differences. Feed the result back into your MMM as a calibration input.
Budget for the holdout cost. A 20% holdout on a $500K monthly channel means roughly $100K in withheld spend per month. That’s the cost of the experiment. Frame it to finance as the cost of knowing whether the other $400K is working.
Risk mitigation checklist:
-
Pre-register your hypothesis and KPI before the test starts.
-
Use pre-test data to confirm test and control groups are balanced.
-
Don’t peek at results mid-test and adjust the holdout size.
-
For Amazon Marketing Cloud incrementality analysis, use AMC’s matched audience methodology to isolate exposed vs. unexposed groups cleanly.
Channel and tactic playbook: where to find ROI gains quickly
The channels below offer the highest-leverage experiments for mid-market and enterprise brands. Each checklist focuses on the one or two changes most likely to move incremental ROAS within a quarter.
Paid search
-
Test single-keyword ad groups against tightly themed ad groups on your top 20 revenue terms. Measure conversion rate and cost per conversion, not just CTR.
-
Run a landing page test: send 50% of traffic to a dedicated PDP vs. a category page. Most brands find a 15–30% conversion rate difference within three weeks.
-
Pause broad match on branded terms for 30 days and measure incremental revenue loss. Many brands discover branded search is largely non-incremental.
Retail media (Amazon, Walmart)
-
Validate Sponsored Products spend with an AMC holdout before scaling. Retail media attribution is notoriously self-reported and tends to overstate contribution.
-
Test Sponsored Brand Video against static Sponsored Brand ads on the same keywords. Video typically improves new-to-brand conversion rates.
-
Use Amazon Sponsored Ads management to separate branded vs. non-branded keyword performance and allocate budget to non-branded terms where incremental lift is higher.
Conversion rate optimization (CRO)
-
Prioritize your highest-traffic, lowest-converting PDPs. A 1% conversion rate improvement on a page generating $1M in revenue is worth $10K per point.
-
Test A+ Content variations: comparison modules vs. lifestyle imagery vs. feature-focused layouts. Measure add-to-cart rate, not just page views.
-
For DTC, run a checkout flow audit. Abandoned cart rate above 70% usually signals a friction point in payment or shipping disclosure, not a pricing problem.
Creative and content
-
Refresh ad creative every 6–8 weeks on paid social. Creative fatigue shows up as rising CPMs and falling CTR before it shows up in ROAS.
-
Test one variable at a time: headline vs. headline, hero image vs. lifestyle image. Multi-variable tests on small budgets produce inconclusive results.
Email and lifecycle marketing
-
Segment your list by purchase recency and CLV tier. Send win-back sequences only to customers with a CLV above your CAC threshold. Mailing everyone costs deliverability.
-
Test send-time optimization on your top three flows. A 10–15% open rate improvement compounds across every campaign that follows.
Programmatic and DSP
-
Run a geo holdout on your DSP campaigns before renewing. Many brands find DSP incremental ROAS is materially lower than the platform’s reported ROAS.
-
Shift budget from retargeting to prospecting if your retargeting audience overlaps heavily with your email list. You’re paying to reach people who were already going to convert.
Mid-market teams that build a coherent first-party data strategy alongside these channel tactics see the compounding benefit. Arete’s mid-market research found a reported ~34% reduction in cost-per-acquisition within nine months for firms that implemented a structured AI-enabled marketing stack, with top performers allocating 17–22% of marketing budget to technology and AI infrastructure.
The operating model that converts measurement into budget action
Measurement programs fail not because the data is wrong but because no one is accountable for acting on it. BCG’s framework is explicit: roughly 10% of the effort is algorithms, 20% is data and technology, and 70% is people and process. Most teams have the ratio inverted.
Roles that must be clearly owned:
-
Analytics owner: Maintains the measurement framework, runs or commissions experiments, and translates results into budget recommendations. This person sits between marketing and finance.
-
Test owner: Accountable for each experiment’s design, execution, and write-up. Rotates by channel but must have a single named owner per test.
-
Finance liaison: Reviews experiment methodology before tests start and signs off on budget implications of results. Without this role, measurement never changes spend.
-
Channel leads: Responsible for implementing changes in their channels within an agreed timeline after a measurement review.
Decision rhythm:
-
Weekly ops review (30 minutes): Channel leads review execution metrics (impression share, CPM, conversion rate). Flag anomalies. No budget changes at this level.
-
Monthly measurement review (90 minutes): Analytics owner presents experiment results and attribution trends. Finance liaison attends. Budget micro-adjustments (up to 10%) can be approved here.
-
Quarterly allocation review (half day): MMM refresh presented alongside experiment results. Full portfolio reallocation decisions made. Finance and CMO both present.
Pro Tip: When presenting experiment results to finance, always show the counterfactual: “If we had not run this test and continued current spend, the estimated revenue impact over 12 months would be X.” Finance responds to avoided cost and opportunity cost far more than to percentage lift numbers.
Skills gaps are real at most mid-market companies. Incrementality testing, MMM interpretation, and response-curve modeling are specialized skills. Investing in one experienced analytics hire or a specialist external partner often delivers more ROI than adding another channel manager.
ROI calculations and reporting templates your finance team will actually use
Measurement only changes decisions when the numbers are presented in a format finance recognizes. NetSuite recommends calculating marketing ROI on gross profit rather than gross revenue wherever possible, and pairing ROI with CLV and CAC to show long-term contribution.
Core formulas:
-
Marketing ROI (gross-profit basis): (Gross Profit from Marketing-Driven Revenue minus Marketing Spend) divided by Marketing Spend. Use gross profit, not revenue, to avoid overstating returns.
-
Incremental ROAS: Incremental Revenue (from experiment) divided by Spend in Test Group. This is the number that matters for channel decisions.
-
CAC: Total Marketing and Sales Spend divided by New Customers Acquired in the same period.
-
CLV: Average Order Value multiplied by Purchase Frequency multiplied by Customer Lifespan. Pair with CAC to get the LTV:CAC ratio.
-
LTV:CAC benchmark: For B2B, MarkCMO notes best-in-class targets of 5:1 to 10:1. For e-commerce, a 3:1 LTV:CAC is a common floor for sustainable acquisition economics.
Sample incremental ROAS walkthrough:
-
You run a geo holdout on a $200K monthly Amazon DSP campaign. 20% of matched markets are held out from DSP exposure.
-
During the four-week test, the exposed markets generate $1.2M in tracked sales. The holdout markets, scaled to equivalent size, generate $1.05M.
-
Incremental revenue attributed to DSP: $150K.
-
DSP spend in the test period: $200K.
-
Incremental ROAS: $150K divided by $200K = 0.75. The campaign is destroying value at current spend levels.
-
Decision: reduce DSP spend by 40%, reallocate to Sponsored Products where a prior experiment showed incremental ROAS of 3.2.
Dashboard fields to include:
-
Spend by channel (weekly and rolling 13-week)
-
Attributed revenue vs. incremental revenue by channel
-
Incremental ROAS with confidence interval from most recent experiment
-
CLV:CAC by acquisition cohort
-
Experiment log: test name, method, KPI, result, status, and recommended action
-
MMM coefficient by channel with last-updated date
When presenting to the C-suite, always show a range estimate, not a point estimate. “Incremental ROAS is between 1.8 and 2.4 with 90% confidence” is more credible than “incremental ROAS is 2.1.” Finance teams that understand statistics will trust the range more than the false precision of a single number.
Common mistakes that erase ROI gains and how to catch them early
Most ROI problems are measurement problems in disguise. Fix the measurement and the budget decisions usually follow.
Red flags and immediate fixes:
-
Overreliance on last-touch attribution. Last-touch systematically over-credits bottom-funnel channels (branded search, retargeting) and under-credits upper-funnel channels (display, video, content). Fix: run one incrementality test on your top last-touch winner. The result is almost always humbling.
-
Poor data hygiene. Duplicate order IDs, mismatched UTM parameters, and untracked offline conversions corrupt every model downstream. Fix: run a monthly data audit comparing platform-reported conversions to your CRM or order management system. Discrepancies above 10% require investigation before any budget decision.
-
Ignoring long-term brand effects. MMM consistently shows that brand-building spend has a longer payback period (often 6–18 months) than performance spend. Teams that cut brand budgets to hit short-term ROAS targets often see performance efficiency decline 12–18 months later as brand equity erodes. Fix: include a brand health metric (aided awareness, share of search) in your quarterly allocation review.
-
Underpowered tests. A test that can’t detect a 10% lift with 80% confidence produces a “no result” that gets interpreted as “no effect.” Fix: run a power calculation before every test. If you can’t achieve adequate power within your budget, either extend the duration or accept that the channel is too small to test independently.
-
Treating platform-reported ROAS as ground truth. Every ad platform has an incentive to show high ROAS. Their attribution windows, view-through credit, and cross-device matching all inflate reported numbers. Fix: always compare platform ROAS to your own incrementality estimate before making scaling decisions.
-
Undifferentiated spend across events and channels. AIA’s marketing guidance notes that trade shows and broad advertising often underperform unless tracked at a granular level. The same principle applies to any channel: if you can’t measure it, you can’t optimize it.
When results look too good, pause before doubling down. A sudden spike in incremental ROAS often signals a data error, a seasonality confound, or a competitor pulling spend, not a genuine efficiency gain.
How Nectar raises incremental ROI for mid-market brands: an applied example
The process Nectar uses with mid-market and enterprise brands follows the same sequence this guide describes, applied specifically to Amazon, Walmart, and Shopify.
-
Baseline assessment. Nectar audits current channel spend, attributed revenue, and listing quality across all active marketplaces. The iDerive analytics platform pulls data into a unified view, flagging channels where spend is high and incrementality data is absent.
-
Measurement program setup. Within the first 60–90 days, Nectar establishes an incrementality measurement baseline using AMC holdout methodology for Amazon and matched-market approaches for Walmart and DTC channels. This gives brands their first clean read on which spend is actually driving net-new sales.
-
Pilot experiments. Nectar runs 2–3 focused experiments per quarter: typically a creative test (A+ Content or video vs. static), a bid strategy test (auto vs. manual targeting on Sponsored Products), and a channel holdout. Each experiment has a defined KPI, duration, and decision rule before it starts.
-
Budget reallocation. Experiment results feed directly into a quarterly allocation review. Spend shifts from low-incremental channels to high-incremental ones in 10–15% increments, with response curves modeled in iDerive to project the revenue impact of each scenario.
-
Scale and compound. As the measurement program matures, the confidence intervals on incremental ROAS estimates narrow. Brands typically see meaningful improvement in incremental ROAS and reductions in CPA within two to three quarters as spend concentrates in validated channels and creative quality improves through continuous testing.
For a concrete example of how DSP reallocation drives conversions, Nectar’s DSP advertising case study shows the mechanics of this process in a live brand context.
Why measurement and people win over tools alone
There’s a version of this conversation that gets stuck on tooling: which MMM vendor, which attribution platform, which AI-powered analytics suite. The tool debate is mostly a distraction.
Every measurement program I’ve seen that failed had adequate tools. What it lacked was a named person accountable for turning experiment results into a budget recommendation, a finance team that was brought in before the test ran rather than after, and a decision cadence that forced a conversation about reallocation on a fixed schedule.
The BCG framing of 70% people, 20% data and tech, 10% algorithms isn’t a soft observation. It’s a resource allocation instruction. If your analytics team is one overloaded analyst and your measurement budget is 80% platform fees, the math is wrong.
The teams that compound ROI gains year over year share one habit: they treat measurement as a standing operating procedure, not a project. They run experiments continuously, review results on a fixed cadence, and make budget decisions based on incremental evidence rather than platform dashboards. The tools change. The discipline doesn’t.
Operating principle: Before you buy another tool, name the person who will act on what it tells you.
Nectar’s measurement-first approach to profitable e-commerce growth
Mid-market and enterprise brands selling on Amazon, Walmart, and Shopify face a specific version of the ROI problem: multiple platforms, each with its own attribution model, each incentivized to claim credit for every sale. Nectar was built to cut through that noise.

Nectar’s full-service e-commerce management combines the iDerive analytics platform for unified incrementality measurement, retail media buying across Amazon and Walmart, end-to-end marketplace operations, and a creative studio for photography, video, and PDP content. The concrete difference from running channels in-house or through separate point solutions: every spend decision is tied to an incrementality estimate, not a platform-reported ROAS number.
For brands ready to move from attribution-based guessing to evidence-based allocation, the right starting point is a measurement audit and a 90-day pilot. Nectar scopes pilots around two or three experiments with clear success metrics and a defined reallocation decision at the end. No long ramp, no ambiguous deliverables. Request a pilot conversation to see what a measurement-first program looks like for your brand.
Sources
Recommended







































































.webp)