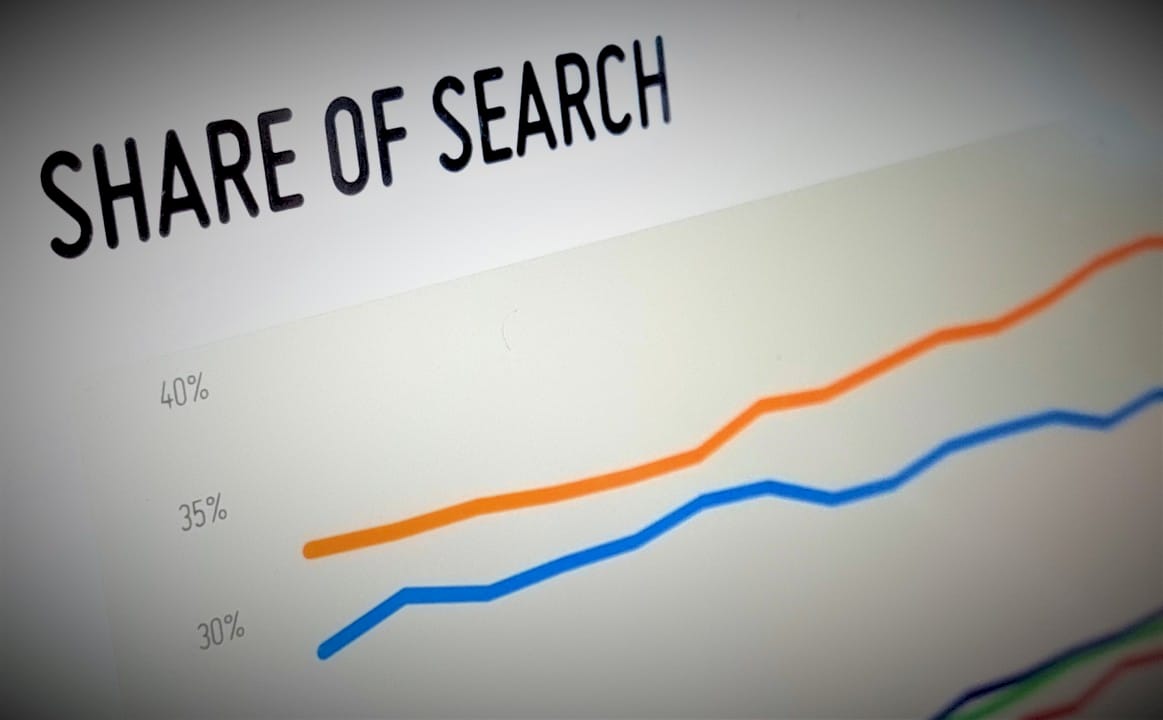
Share of search (SoS) is the percentage of branded search queries your brand captures out of all search queries for your product category. The formula is simple: (brand search volume ÷ total category search volume) × 100. If your brand pulls 120,000 searches in a month and the full category generates 335,000, your share of search is roughly 36%.
What makes SoS worth tracking is not the snapshot. It is the signal. SoS is a behavioral metric measuring what people actually do rather than what they say in a survey, and research shows it can predict market-share movement before sales data catch up.
Three things to know before going deeper:
What does share of search actually measure?
SoS counts branded queries. When someone types “Nike running shoes” rather than just “running shoes,” that branded query is what SoS captures. The metric divides those branded queries by the total volume of queries across all competing brands in the same category, then multiplies by 100.
That distinction matters because SoS sits in a different lane from two metrics brand managers often confuse it with.
SoS vs. share of voice vs. market share
Share of Voice (SoV) measures how much of the total paid or earned media exposure your brand owns compared to competitors. It draws on ad impression data, media spend, or social mentions. SoV tells you how loudly you are speaking in the market.
Share of Search (SoS) measures how much of the category’s search demand flows to your brand name. The data source is search query volume, pulled from Google Trends, Semrush, Mangools, or similar tools. SoS tells you how much the market is thinking about you.
Market share measures actual revenue or unit sales as a percentage of total category sales. It is the lagging outcome. SoS and SoV are the leading inputs.
Here is how the three compare across the dimensions that matter most to brand managers:
One methodological point worth flagging: the category you define as your denominator determines everything. If you are a protein bar brand and you include “meal replacement shakes” in your category query set, you dilute your SoS artificially. Practitioners recommend including only brands consumers actively compare at the point of purchase. A sloppy category definition produces a number that looks precise but means nothing.
Qualtrics and Semrush both offer frameworks for building category query sets, and Qualtrics in particular provides guidance on triangulating SoS with sales data to validate the denominator before you commit to a reporting cadence.
How to calculate share of search step by step
The calculation itself is not complicated. Getting the inputs right is where most teams stumble.
Worked example: Suppose you are tracking three brands in the premium coffee category.
Your SoS equals your brand’s search volume divided by the total category search volume, expressed as a percentage.
Data-validation checklist before you finalize:
Which tools help you measure share of search?
Google Trends
Google Trends is the fastest way to get a directional SoS reading at no cost. Enter your brand name and each competitor’s brand name as separate search terms in the comparison view. Google returns a relative interest index (0–100) for each term over your chosen period.
To approximate SoS from the index: note each brand’s peak index value, then calculate each brand’s share of the sum of all index values. If Brand A peaks at 75, Brand B at 60, and Brand C at 40, the total is 175. Brand A’s approximate SoS = (75 ÷ 175) × 100 = 42.9%. This is not a precise absolute-volume calculation, but it is directionally reliable for trend detection.
Google Trends also lets you filter by geography and category, which makes it particularly useful for regional campaigns and seasonal analysis. The limitation is scale: Google Trends compares up to five terms at once, which gets unwieldy for categories with many competitors.
Semrush
Semrush provides estimated absolute monthly search volumes for any keyword, which means you can build a true SoS calculation rather than an index approximation. Use the Keyword Overview tool to pull volumes for each branded query, export to a spreadsheet, sum by brand, and apply the formula. Semrush also surfaces related branded queries you may have missed, which strengthens your query set.
The trade-off is cost. Semrush plans start at a subscription rate that puts it out of reach for teams running a one-off analysis, though it pays for itself quickly if SoS is part of a monthly reporting cadence.
Mangools
Mangools offers a more affordable entry point for keyword volume data through its KWFinder tool. The interface is cleaner than Semrush for simple volume lookups, and the data quality is solid for most brand-level SoS work. It lacks some of the competitive intelligence depth Semrush provides, but for mid-market brands tracking five to ten competitors, it covers the job.
Qualtrics
Qualtrics approaches SoS from a research and brand-tracking angle rather than a keyword-tool angle. Its platform can integrate search data with survey-based brand health metrics, which is useful when you want to validate whether a rise in SoS actually corresponds to improved brand awareness or purchase intent. For teams that already run brand tracker studies, Qualtrics is the natural place to add SoS as a behavioral complement to attitudinal data.
Comparison across key dimensions:
Pro Tip: Start with Google Trends to establish the trend direction, then use Semrush or Mangools to pull absolute volumes for the same query set. The Trends index tells you whether your SoS is rising or falling; the keyword tool tells you by how much. Running both in parallel catches discrepancies that signal data quality issues before they reach a client deck.
Why SoS belongs in your brand measurement toolkit
The core argument for SoS comes from Les Binet, one of the most cited researchers in marketing effectiveness. Binet’s work, presented at the IPA, positions SoS as a behavioral metric that captures what people do rather than what they report in surveys. Because search behavior responds to advertising, word of mouth, and product experience in near real time, SoS can detect demand shifts weeks or months before those shifts show up in sales data or market share reports.
That predictive quality is what separates SoS from most brand health metrics. Survey-based awareness scores are collected quarterly at best. Sales data lags by weeks. SoS is available monthly, sometimes weekly, and it reflects actual consumer behavior rather than self-reported intent.
The practical use cases break down into four categories:
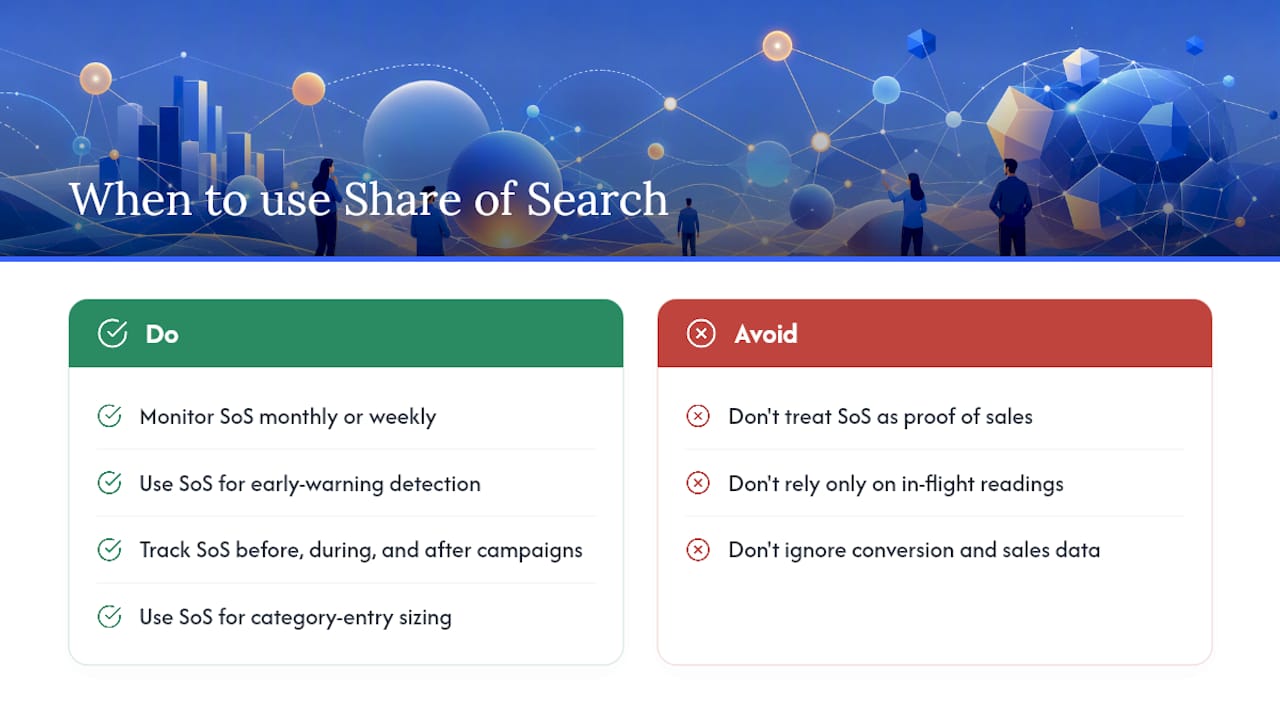
Early-warning demand detection. A brand losing two percentage points of SoS over three consecutive months is almost certainly losing ground before the sales report confirms it. That window gives marketing teams time to respond with a campaign, a pricing adjustment, or a product refresh rather than reacting after the damage is done.
Campaign effectiveness measurement. Run a brand-building campaign and track SoS before, during, and for eight weeks after. A lift in SoS during the flight that holds after the campaign ends is a strong signal of genuine brand-demand growth, not just media-driven recall.
Organic brand health tracking. SoS moves even when you are not running paid media. A competitor’s product launch, a viral moment, or a PR crisis all show up in SoS before they show up anywhere else. Tracking SoS monthly gives you a continuous read on brand health that does not depend on your own media activity.
Category-entry sizing. Before entering a new market or launching a new product line, SoS analysis on the existing category tells you how concentrated demand is. A category where one brand holds 60% SoS is a harder entry than one where the top brand holds 25%.
Research from Qualtrics confirms that the correlation between SoS and market share is strong but not one-to-one. SoS is a leading indicator, not a guarantee. Teams that treat a rising SoS as automatic proof of future sales gains, without triangulating with conversion data and sales trends, tend to be disappointed. The signal is real; the causation requires context.
Empirical observations from brand-building research suggest that advertising’s impact on SoS tends to follow a split between short-term and long-term uplift, reinforcing the case for tracking SoS across both campaign windows and extended horizons rather than relying on in-flight readings alone.
Tactical levers that reliably lift share of search
Improving SoS is fundamentally about increasing the volume of branded searches your brand generates relative to competitors. Every tactic below works through that mechanism.
Pro Tip: Set your SoS measurement window before a campaign launches, not after. Define the baseline period (the 12 weeks prior), the flight period, and the post-flight measurement window (four to eight weeks). Agreeing on these dates in advance prevents the temptation to cherry-pick the window that shows the best result.
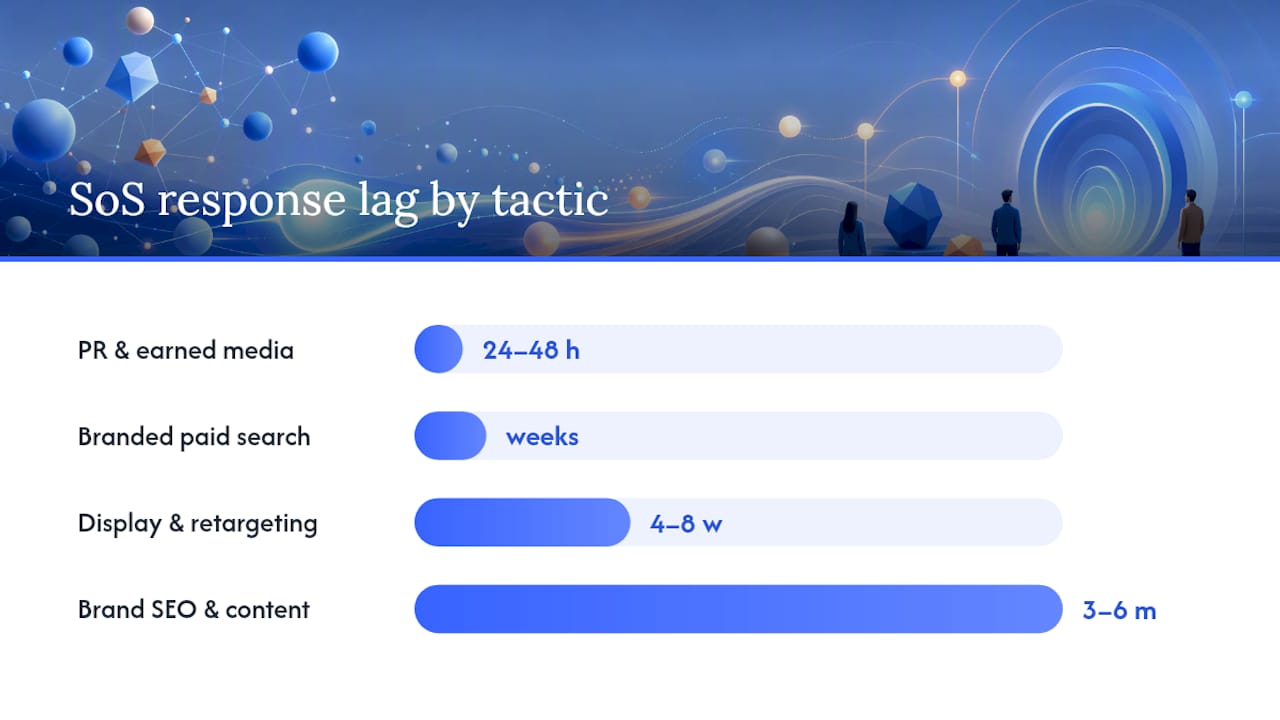
Balancing short-term activation against long-term brand investment matters here. Branded paid search produces fast SoS lifts that fade when spend stops. Brand-building content and PR produce slower lifts that compound over time. A healthy SoS strategy uses both, with the budget split informed by how quickly you need to move the metric versus how durably you need to hold the gain.
How to read SoS trends without getting it wrong
Common pitfalls that distort the signal
Seasonality. A category like sunscreen has predictable SoS swings tied to the calendar. If your SoS rises every June, that is not a brand health improvement. Always compare SoS to the same period in the prior year, not just to the previous month.
Ambiguous brand keywords. Brand names that double as common words pull in irrelevant search volume. A brand called “Tide” or “Dove” will have its SoS contaminated by searches for the common noun. Document which queries you exclude and apply the same exclusions consistently across every measurement period.
Category definition drift. If you add a new competitor to your category query set mid-year, your denominator changes and your historical SoS becomes incomparable. Lock the category definition at the start of each annual measurement cycle and document any changes separately.
Scale and incumbent effects. A brand with 5% SoS can double to 10% with a single successful campaign. A brand with 50% SoS needs a category-level event to move the needle by the same amount. Interpret percentage-point changes in the context of your starting position.
Short windows and small samples. A two-week SoS reading is almost always noise. Google Trends data at the weekly level has significant sampling variance. Use monthly aggregates as your primary unit and weekly data only for directional checks.
Branded search volume rising does not automatically mean market share will follow. A competitor’s crisis can spike your branded searches without any action on your part, and that spike will not convert to sales if your product or pricing is not competitive. SoS is a demand signal, not a sales guarantee. Always triangulate with conversion data before drawing conclusions.
Diagnostic checklist for validating an SoS signal
How brand managers and agencies operationalize SoS
The difference between teams that get value from SoS and teams that do not usually comes down to workflow, not data access. Here is how a structured agency workflow looks in practice.
Measurement cadence. Monthly is the standard for ongoing brand health tracking. Weekly pulls are useful during active campaign flights. Quarterly reviews are the right cadence for strategic decisions about budget allocation and competitive positioning.
Dashboard KPIs to pair with SoS. SoS does not tell the full story alone. Pair it with:
Reporting structure. An executive summary needs three numbers: current SoS, change vs. prior period, and change vs. prior year. An analyst dashboard needs the full query-level breakdown, the category denominator, the data source, and the diagnostic checklist results.
Reproducible workflow. The operational steps that make SoS reporting consistent across months:
The teams that get the most from SoS are the ones that treat it as a standing agenda item in monthly brand reviews, not a metric they pull when something looks wrong. By the time a problem is obvious in sales data, SoS has usually been signaling it for two or three months. The metric earns its keep by shortening that reaction time.
At Nectar, SoS tracking integrates directly into the iDerive analytics platform, which connects search-behavior signals to retail conversion funnels across Amazon, Walmart, and Shopify. That connection between branded search demand and on-platform conversion is where the metric moves from interesting to operational. For brands managing performance metrics across e-commerce channels, SoS is one of the cleaner leading indicators available.
Key Takeaways
Share of search is a behavioral leading indicator: brands that track it monthly and triangulate it with sales data consistently detect demand shifts earlier than those relying on lagging metrics alone.
PointDetailsDefine SoS preciselySoS = (brand search volume ÷ total category search volume) × 100; category definition determines accuracy.Use the right tool for the jobGoogle Trends for trend direction and geo breakdowns; Semrush or Mangools for absolute volumes and precise percentages.Track monthly, review quarterlyMonthly cadence catches early signals; quarterly reviews drive budget and strategy decisions.Pair SoS with conversion dataA rising SoS that does not convert to sales signals a product or pricing problem, not a brand health win.Act on the signal earlyA two-to-three-month SoS decline almost always precedes a sales decline; use that window to respond before the damage is done.
The metric most brand managers underestimate
Most brand managers I talk to have heard of share of search. Fewer have it in their monthly reporting stack. The gap is usually not skepticism about the metric; it is the assumption that setting it up requires more infrastructure than it does.
The reality is that a defensible SoS baseline takes about two hours to build with Google Trends and a spreadsheet. You define the competitor set, pull the index values, normalize them, and you have a number you can track month over month. Semrush or Mangools adds precision when you need it, but the directional signal from Trends is good enough to start making decisions.
What I find more interesting is how SoS changes the conversation inside a brand team. When you can show that your branded search volume has been declining for three months while a competitor’s has been rising, the question shifts from “should we invest in brand building?” to “how fast do we need to move?” That is a more productive conversation, and it is grounded in behavior rather than opinion.
The brands that use SoS most effectively treat it as an early-warning system, not a vanity metric. They set thresholds, they escalate when the signal crosses them, and they connect the search data to what is happening in their retail conversion funnels. That last step, connecting SoS to on-platform conversion, is where the metric pays for itself.
If you want agency support building that connection, Nectar’s brand growth services include SoS tracking integrated with retail media and marketplace analytics.
Authoritative references and tools for follow-up reading
The sources below are the most useful starting points for teams building or refining a share of search program.
On choosing between free and paid measurement: Google Trends is the right starting point for any team. It costs nothing, requires no setup, and gives you a directional read within minutes. Move to a paid tool like Semrush or Mangools when you need absolute volumes for a precise SoS percentage, when you are tracking more than five competitors, or when SoS is feeding into a formal brand health report that goes to senior leadership. The free-to-paid upgrade is a workflow decision, not a data-quality leap.
Recommended





























































.webp)