Advertising return on investment (ROI) is defined as the net profit generated by ad spend divided by the total cost of that spend. It is the single most direct measure of whether your advertising dollars are building a profitable business or just buying revenue. Marketing professionals at mid-sized and enterprise e-commerce brands often confuse ROAS with true ROI, and that confusion costs real margin. Understanding why track ad spend ROI matters starts with recognizing that revenue and profit are not the same number. This article explains the difference, exposes the gaps in platform-reported metrics, and outlines the measurement methods that give you a defensible view of what your advertising actually earns.
Why tracking ad spend ROI is the foundation of profitable growth

Ad spend ROI connects every dollar of advertising investment to a bottom-line outcome. ROAS, the more common metric, measures revenue returned per ad dollar. ROI measures profit returned per ad dollar. That distinction changes every budget decision you make.
A campaign generating $5 in revenue for every $1 spent looks healthy by ROAS standards. But if the product costs $3 to make, $0.80 to fulfill, and $0.30 in payment fees, the actual margin on that $5 is roughly $0.90. Subtract the $1 in ad spend and the campaign is unprofitable. ROAS never shows you that math.
Brands that track both ROAS and profit-based ROI simultaneously are 2.3x more likely to maintain positive margins during promotional periods, according to a Forrester Research survey of 350 e-commerce leaders. That finding tells you something concrete: tracking only one metric is a structural risk, not just a reporting gap.
The importance of tracking ad spend grows as marketing complexity increases. Privacy regulations, browser restrictions, and multi-channel attribution all make it harder to know which campaigns are actually working. Brands that build profit-based ROI tracking into their reporting cadence are better positioned to make budget calls that hold up at quarter-end.
What is the difference between ROAS and profit-based ROI?
ROAS and profit-based ROI answer different questions. ROAS answers “how much revenue did this ad generate?” ROI answers “how much money did this ad make after all costs?”
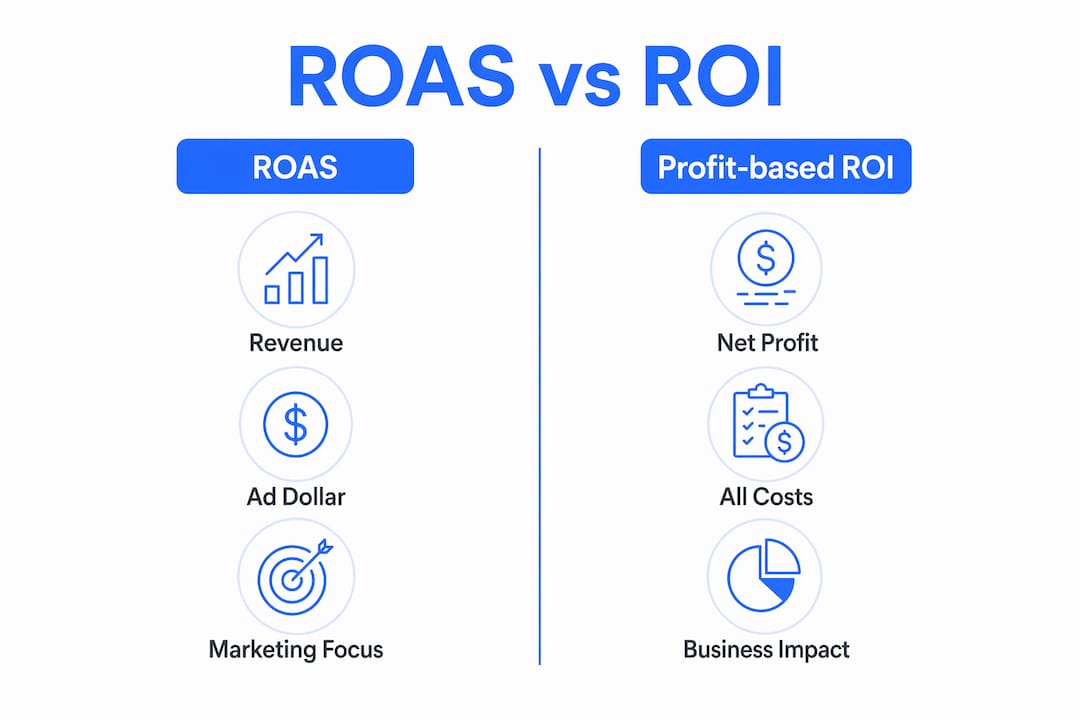
What ROAS measures and where it falls short
ROAS is calculated by dividing ad revenue by ad spend. It is fast to compute and easy to communicate. Platform dashboards report it automatically. The problem is what ROAS ignores.
Each of these costs can turn a strong-looking ROAS into a loss. During promotional periods, the gap widens fast.
When to use each metric
ROAS is useful for comparing creative performance within a single channel where costs are constant. It tells you which ad unit or keyword is generating more revenue per dollar. Profit-based ROI is the right metric for cross-channel budget allocation, promotional planning, and any decision that affects the business’s bottom line.
Pro Tip: Build a simple margin-adjusted ROAS target for each product category. Divide your gross margin percentage by your target net margin percentage to get the minimum ROAS needed to break even. Any campaign below that threshold is losing money regardless of what the dashboard shows.
Why platform-reported ROAS metrics often overstate performance
Platform-reported ROAS is almost always higher than the return your finance team would recognize. The gap is not a rounding error.
The cumulative effect is significant. Platform-reported revenue numbers typically exceed actual e-commerce platform revenue by 30–60% due to attribution overlap and over-crediting returning customers. That means a reported ROAS of 4.0 could reflect a true ROAS closer to 2.5 or lower. Decisions made on the inflated number lead to overspending on channels that are not delivering the return they appear to deliver.
The gap between platform-reported ROAS and true incrementality-based ROAS is rarely less than 30% and often exceeds 60% for e-commerce brands in the $5M–$50M revenue range. That is not a measurement nuance. It is a budget allocation problem.
How do incrementality testing and marketing mix modeling improve ROI measurement?
Two methods address the attribution and tracking gaps that make platform ROAS unreliable: incrementality testing and Marketing Mix Modeling (MMM). Both shift the measurement question from “which channel got credit?” to “what revenue would not have happened without this ad?”
Incrementality testing
Holdout tests withholding ads from 10–20% of audiences yield the most accurate measure of true ad lift. The method is straightforward. You divide your audience into two groups. One group sees your ads normally. The other group is held out and sees no ads. You compare the purchase rates between groups. The difference is the incremental revenue your ads actually caused.
Key benefits of incrementality testing include:
The operational challenge is that holdout tests require withholding revenue from a portion of your audience during the test period. For brands running continuous promotions, that tradeoff needs planning.
Marketing Mix Modeling
MMM uses aggregated sales and spend data to model the contribution of each channel to overall revenue. It does not rely on individual user tracking, which makes it compatible with privacy regulations and browser restrictions. MMM also captures time lags, meaning it can show that a brand awareness campaign in january contributed to conversions in march.
Pro Tip: Run incrementality tests on your top two or three channels before building a full MMM. The holdout results give you a ground-truth calibration point that makes your MMM outputs far more reliable.
The combination of both methods gives brand managers a measurement system that holds up to scrutiny from finance and leadership. Simple, defensible metrics that leadership understands are more valuable than complex models that only the analytics team can explain. Complexity without clarity does not improve decisions.
How tracking ad spend ROI guides smarter budget allocation
Accurate ROI data changes how you allocate budget across channels, products, and time periods. The benefits of ad spend analysis show up most clearly when you use profit-based ROI to make three specific types of decisions.
Scaling and pausing channels
A channel with a high platform-reported ROAS but a low incrementality-adjusted ROI is a candidate for budget reduction. The reported number looks good because the platform is taking credit for organic purchases. The true number tells you the ad is not causing much additional revenue. Reallocating that budget to a channel with a lower reported ROAS but a higher incremental lift often improves total margin.
Managing promotional periods
Promotions compress margins by design. Tracking both ROAS and profit-based ROI during promotional events like Prime Day or Black Friday prevents the common mistake of scaling ad spend into a period where every incremental sale is already below breakeven. The ROI view shows you the floor. The ROAS view does not.
Avoiding ad spend saturation
Marginal incremental ROAS identifies the point at which additional ad spend stops generating proportional returns. Every channel has a saturation curve. Spending past that point reduces overall ROI even as total revenue grows. Short-term ROI windows also undervalue brand-building channels, which means brands that measure only immediate return tend to underfund upper-funnel activity.
For practical implementation, a weekly 30-minute ad efficiency review covering six key metrics prevents channel drift and quarter-end surprises. The discipline of a regular review cadence matters more than the sophistication of the model. Consistent measurement beats occasional deep analysis.
Retail KPIs tracked through business intelligence tools give brand managers a structured way to shift from ROAS-only reporting to profit-based ROI dashboards. The shift does not require a full data science team. It requires clean data and a consistent process.
Integration and data quality are the primary barriers to effective ROI tracking. Cleaning CRM, financial, and ad platform data before building complex models is the right sequence. Brands that skip the data quality step produce ROI reports that no one trusts.
Key Takeaways
Tracking ad spend ROI requires combining profit-based metrics, clean data integration, and causal measurement methods to make budget decisions that hold up under financial scrutiny.
PointDetailsROAS vs. profit-based ROIROAS measures revenue per ad dollar; profit-based ROI accounts for all costs and shows true profitability.Platform ROAS overstates returnsReported ROAS can exceed true incrementality-based ROAS by 30–60% due to attribution overlap and returning customer inflation.Incrementality testing is essentialHoldout tests on 10–20% of audiences provide causal proof of ad lift, removing attribution bias from your measurement.Data quality comes firstClean CRM, financial, and ad platform data before building models. Dirty inputs produce ROI reports that leadership will not act on.Weekly review cadenceA consistent 30-minute weekly efficiency review prevents channel drift and protects margins at quarter-end.
The measurement trap most e-commerce brands fall into
After working with brands across Amazon, Walmart, and Shopify, the pattern I see most often is not a lack of data. It is an overabundance of platform-reported numbers that feel authoritative but measure the wrong thing.
The most common mistake is treating a strong ROAS as proof that a campaign is profitable. I have seen brands scale Meta spend aggressively based on a reported 5x ROAS, only to find that their actual margin after COGS, fulfillment, and returns was negative. The platform was taking credit for customers who would have purchased anyway.
The fix is not a more sophisticated model. The fix is connecting your ad platform data to your actual order data, your return rates, and your fulfillment costs. That connection is what advertising attribution and incrementality analytics are built to provide. Once you see the true numbers, budget decisions become much clearer.
The brands that build reliable measurement systems share one trait: they prioritize consistency over complexity. They run the same holdout tests every quarter. They review the same six metrics every week. They do not change their attribution model every time a platform updates its algorithm. That consistency is what makes the data trustworthy enough to act on.
How Nectar helps brands measure and grow advertising ROI

Nectar’s iDerive analytics platform connects ad spend, revenue, fulfillment costs, and return data into a single profit-based ROI view across Amazon, Walmart, and Shopify. Brand managers get the margin-adjusted reporting that platform dashboards cannot provide. Nectar’s fully managed advertising and growth services combine retail media management, incrementality testing, and anomaly detection to protect margins during promotions and identify channels worth scaling. If your current reporting relies on platform ROAS alone, Nectar’s team can build the measurement foundation your budget decisions actually need.
FAQ
What is ad spend ROI and how does it differ from ROAS?
Ad spend ROI measures net profit generated per dollar of advertising investment, accounting for all costs including COGS, fulfillment, and returns. ROAS measures only revenue per ad dollar and ignores costs entirely.
Why does platform-reported ROAS overstate true performance?
Platform-reported ROAS overcounts revenue by crediting ads for returning customer purchases and overlapping attribution windows across channels. The gap between reported and true incrementality-based ROAS is rarely less than 30%.
What is incrementality testing in advertising?
Incrementality testing uses holdout groups, typically 10–20% of your audience, to measure the revenue that would not have occurred without your ads. It is the most accurate method for calculating true ad lift.
How does Marketing Mix Modeling support ROI measurement?
Marketing Mix Modeling uses aggregated sales and spend data to estimate each channel’s contribution to revenue without relying on individual user tracking. It captures time lags and cross-channel effects that last-click attribution misses.
How often should brands review ad spend ROI?
A weekly 30-minute review of key efficiency metrics prevents channel drift and protects margins before problems compound at quarter-end. Consistent cadence matters more than the sophistication of the reporting model.
Recommended
.png)