Customer lifetime value (CLV) is the total gross profit a business can expect from a single customer across the entire relationship. Get that number right, and it tells you exactly how much you can afford to spend acquiring a new customer, which segments deserve your best retention investment, and where your growth is actually coming from. The simplest version of the formula: CLV = Average Order Value × Purchase Frequency × Customer Lifespan.
Key Takeaways
Customer lifetime value is a profit metric, not a revenue metric, and the distinction determines whether your acquisition and retention decisions are grounded in reality or optimistic math.
CLV measures the total gross profit expected from a customer across the full relationship, calculated as AOV × Purchase Frequency × Lifespan × Gross Margin.
Revenue-based CLV overstates value and leads to overspending on acquisition; always apply gross margin before comparing CLV to CAC.
Calculate 12-month cohort gross profit per customer by channel before building predictive models; it’s more defensible and immediately actionable.
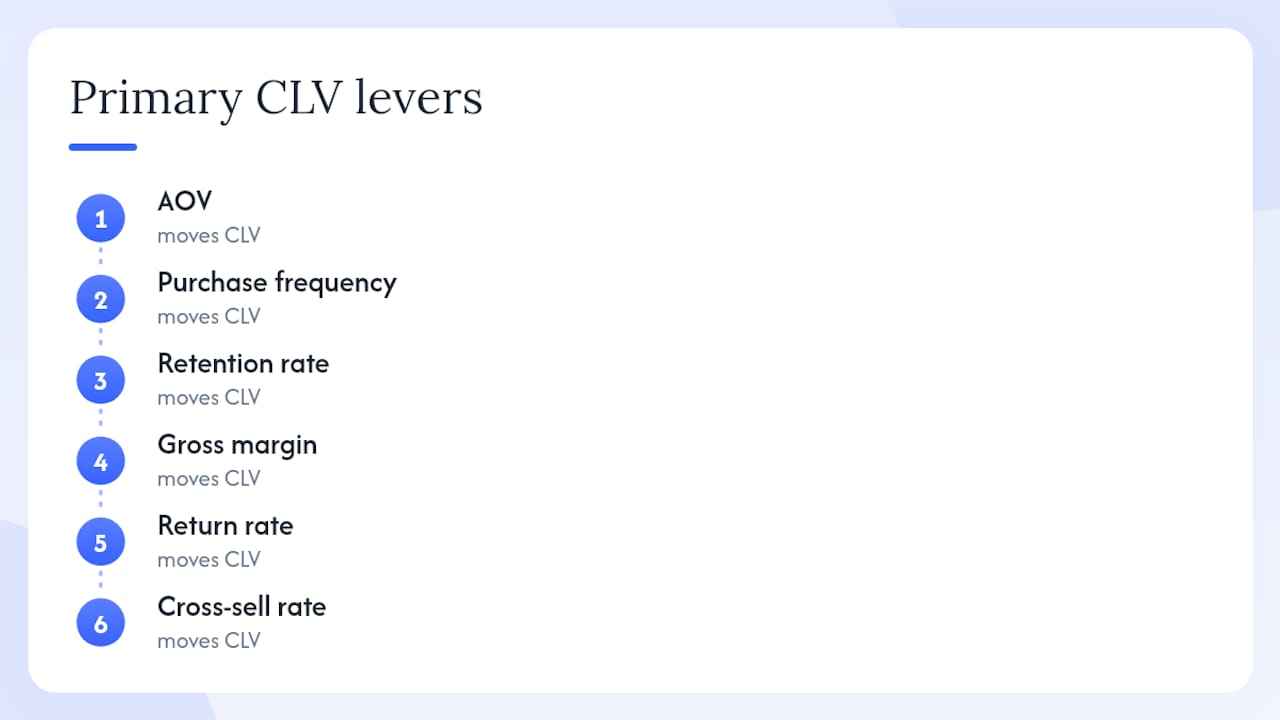
AOV, purchase frequency, retention rate, gross margin, return rate, and cross-sell rate each move CLV; map every tactic to one primary metric before running it.
Set a channel-specific CAC cap from your 12-month cohort CLV, then launch one post-purchase email sequence and measure 90-day repeat rate against a holdout group.
What does customer lifetime value actually measure?
Customer lifetime value measures how much a customer is expected to spend with a company from their first to their last purchase. You’ll see it written as CLV, LTV, or CLTV depending on the team. Finance teams tend to say LTV; marketing teams say CLV. The underlying concept is the same, though the formula used often isn’t.
That’s the first thing to get straight: CLV and LTV are synonyms, but revenue-based CLV and profit-based CLV are not.
Revenue-based vs. profit-based CLV
Revenue-based CLV counts every dollar a customer spends. A skincare brand with a customer who spends a consistent amount per year from their mid-twenties to around age 60 would calculate a sizable lifetime revenue figure. Clean, easy, and largely useless for budget decisions.
Profit-based CLV subtracts the cost of goods sold and any variable costs before multiplying out. That’s the number that should govern your customer acquisition cost (CAC) ceiling, because you can’t spend revenue you haven’t earned yet.
Bloomreach’s CLV guide makes this point directly: profit-adjusted CLV is preferable when comparing to CAC and making budget decisions. Using revenue-based CLV to set acquisition budgets is one of the most common and costly mistakes in e-commerce.
How CLV relates to ARPU and AOV
Average Revenue Per User (ARPU) and Average Order Value (AOV) are inputs into CLV, not substitutes for it. ARPU tells you what a customer generates per period; AOV tells you the size of a single transaction. Neither accounts for how long a customer stays or how often they return. CLV combines all three dimensions: size, frequency, and duration.
How do you calculate CLV step by step?
There are three formulas worth knowing, each suited to a different level of data maturity.
The simple formula
CLV = AOV × Purchase Frequency × Customer Lifespan
This works for a quick directional estimate. Pull your average order value from your orders table, calculate how many times the average customer buys per year, and estimate how many years they stay active. Multiply the three together.
The profit-adjusted formula
CLV = AOV × Purchase Frequency × Customer Lifespan × Gross Margin %
This is the version you should use for any budget decision. According to NetSuite’s CLV reference, profit-adjusted CLV is the standard practitioners rely on when comparing lifetime value to acquisition cost.
The NPV-adjusted formula (for multi-year horizons)
When you’re projecting CLV over three or more years, a dollar of profit in year three is worth less than a dollar today.
CLV = Σ (Gross Profit in Period t) / (1 + discount rate)^t
Use this when your finance team needs CLV for long-range forecasting or when you’re modeling subscription cohorts over extended periods.
Worked example: step by step
Here’s a concrete walkthrough for a mid-market apparel brand:
That $306 figure is what you can work with. If your blended CAC is $120, your LTV:CAC ratio is 2.55:1. Whether that’s healthy depends on your business model, but you now have a number to pressure-test.
Data you need to run this calculation
Kissmetrics recommends calculating cumulative gross profit per acquired customer at a fixed, defensible horizon (12 months is a good starting point) rather than projecting an infinite-horizon LTV. That approach keeps your numbers grounded in what actually happened, not what a model hopes will happen.
Which CLV model should you use?
The right model depends on your data maturity, your team’s analytics capacity, and what decision you’re trying to make. Three main approaches exist, each with distinct trade-offs.
Historical CLV
Historical CLV sums the realized gross profit from a customer to date. No forecasting, no assumptions. You know exactly what each customer has contributed.
Best for: Reporting, channel-level performance reviews, and understanding which acquisition sources produced the most valuable customers. If your analytics team is small or your data is messy, start here.
Limitation: It looks backward. A customer who bought once two years ago looks identical to a customer who bought once last month, even though their future value is very different.
Cohort-based CLV
Cohort-based CLV groups customers by acquisition date (month or quarter) and tracks their cumulative gross profit over a fixed horizon, say 12 or 24 months. You’re not guessing at “lifetime.” You’re measuring what a cohort actually generated by a specific age.
Best for: Channel attribution, retention benchmarking, and setting CAC caps by acquisition source. This is the approach Kissmetrics advocates for operational CLV used in budgeting.
Limitation: You can only measure cohorts that are old enough. A 12-month cohort CLV requires 12 months of data from that cohort.
Predictive CLV
Predictive CLV uses statistical or machine-learning models to forecast future customer value. The most common probabilistic models are BG/NBD (Buy Till You Die, Beta Geometric/Negative Binomial Distribution) for purchase frequency and the Gamma-Gamma model for spend. Supervised regression models are also used when you have rich feature sets.
Best for: Personalization at scale, proactive churn intervention, and prioritizing high-value customers before they defect. Useful when you have large customer bases and validated historical data.
Limitation: Perspective AI warns that predictive CLV extrapolates the past and cannot reveal why a customer’s behavior changed. A model trained on pre-pandemic behavior will confidently produce wrong answers for post-pandemic cohorts. Treat predictions as a starting point for investigation, not a final answer.
Choosing the right approach
What factors drive CLV up or down?
Six operational levers move CLV. Understanding which one is your biggest constraint tells you where to focus first.
Pro Tip: Run a simple experiment: pick one driver (say, purchase frequency) and test a single intervention (a post-purchase email sequence at day 30 and day 60). Measure the 90-day repeat rate for the test group versus a holdout. That’s your CLV lever in action, isolated and measurable.
Cohort segmentation is the cleanest way to measure these drivers. Segment by acquisition channel, acquisition month, and product category. Patterns that look invisible in aggregate become obvious when you break the data into dated cohorts.
Why does CLV matter for business decisions?
CLV is most useful when it changes a decision. Here are the four decisions where it has the most leverage.
Setting CAC budgets by channel
If your 12-month cohort CLV for customers acquired through paid search is $220 and your target LTV:CAC ratio is 3:1, your CAC ceiling for that channel is roughly $73. Zendesk’s CLV guide notes that a commonly referenced LTV:CAC guideline is around 3:1, but that benchmark varies significantly by industry and margin structure.
The point isn’t to hit a benchmark. It’s to set a channel-specific CAC ceiling based on the actual gross profit that channel’s customers generate.
Customer segmentation and prioritization
Not all customers are equal. CLV analysis typically reveals that a small percentage of customers generate a disproportionate share of total profit. Identifying that segment lets you allocate retention spend, loyalty rewards, and personal outreach where they’ll have the highest return.
Retention investment decisions
If you know a customer’s predicted CLV is $400 and they’re showing early churn signals (no purchase in 90 days, declining email engagement), spending $15 on a targeted win-back campaign is an easy decision. Without CLV, that spend feels discretionary. With it, it’s a calculated bet.
Revenue forecasting from cohorts
Cohort-based CLV lets you project future revenue from existing customers with reasonable accuracy. If your January cohort has a 12-month CLV of $280 and you acquired 5,000 customers that month, you have a $1.4M gross profit baseline from that cohort alone. Stack twelve months of cohorts and you have a forward-looking revenue model grounded in observed behavior.
In B2B and high-acquisition-cost contexts, this kind of forecasting is especially critical. GOb2b’s analysis of B2B e-commerce makes the case that minimizing CAC while maximizing CLV is the central profitability equation for B2B sellers, where deal cycles are long and switching costs are high.
How do you increase CLV in practice?
Small, compounding improvements across multiple levers beat a single large intervention. Here’s a ranked list of tactics by expected impact and ease of execution.
For each tactic, map it to one primary metric before you run it. That discipline keeps experiments clean and results interpretable. Bloomreach’s research confirms that mapping each tactic to the metric it moves creates a clear experiment roadmap and prevents the common mistake of running multiple changes simultaneously and not knowing which one worked.
How Nectar operationalizes CLV improvements for brands
Understanding CLV is one thing. Systematically acting on it across creative, lifecycle, and paid media is another. Here’s how Nectar approaches CLV improvement for mid-market and enterprise brands on Amazon, Walmart, and Shopify.
These outcomes are illustrative of the workflow, not guarantees. CLV improvement timelines depend heavily on data quality, category dynamics, and baseline retention rates.
Common mistakes that distort your CLV numbers
Even well-intentioned CLV calculations go wrong in predictable ways. Watch for these:
A quick sanity check: compare your formula-derived CLV against the actual cumulative gross profit of a closed cohort (one that’s at least 12 months old).
How to get started calculating CLV in your business
Follow this checklist in order. Skipping steps produces numbers that look precise but aren’t.
Pro Tip: Don’t wait for perfect data. A 12-month cohort CLV calculated from imperfect data is more useful than a theoretically perfect model that never gets built. Start with what you have, document your assumptions, and refine as data quality improves.
For brands that want to move faster, leveraging e-commerce data systematically from day one shortens the time to a defensible CLV number significantly.
The part most CLV articles skip
There’s a version of CLV thinking that becomes a trap. You build a predictive model, it produces a score for every customer, and suddenly the score becomes the answer. Budget decisions get made based on model output without anyone asking whether the model’s assumptions still hold.
The most useful thing I’ve seen practitioners do is treat a high CLV score as a question, not a conclusion. Why does this customer score high? Is it because they buy frequently, or because they made one large purchase that inflated their predicted value? Are they in a product category with stable repurchase behavior, or one where a single trend drove a spike? A score that can’t be explained is a score that can’t be trusted.
The same caution applies to benchmarks. A 3:1 LTV:CAC ratio is a reference point, not a law. The number that matters is the one derived from your actual cohort data, not the one cited in a blog post.
CLV is most powerful when it’s treated as a living measurement, updated quarterly, segmented by channel and cohort, and connected directly to the decisions it’s supposed to inform. When it becomes a static number on a dashboard that nobody questions, it stops being useful.
Sources
Recommended






































































.webp)