What profit margin optimization actually means for marketplace brands
Profit margin optimization is the disciplined process of identifying and closing the gap between what a product earns and what it costs to sell, fulfill, and advertise on platforms like Amazon, Walmart, and Shopify. For mid-market and enterprise brands, that gap is rarely obvious. It hides inside referral fees, FBA surcharges, retail media spend, and inventory carrying costs that compound quietly across thousands of SKUs.
The foundation is contribution margin per unit: revenue minus all variable costs tied to that specific sale. That means platform fees, fulfillment, returns, and advertising spend all belong in the calculation before you call a unit profitable. Brands that skip this step and measure gross margin alone are flying blind.
Key structural elements every brand manager needs to track:
-
LTV:CAC ratio at a 3:1 minimum, measured separately for buyer and supplier acquisition
-
Supply-side acquisition cost (SAC), which can silently drain margins even when buyer CAC looks healthy
-
Retail media as a structural cost, not a discretionary marketing line
-
Dynamic pricing with profit floors set at the SKU level to prevent algorithmic losses
-
Platform fee structures on each channel, since Amazon, Walmart, and Shopify each extract margin differently
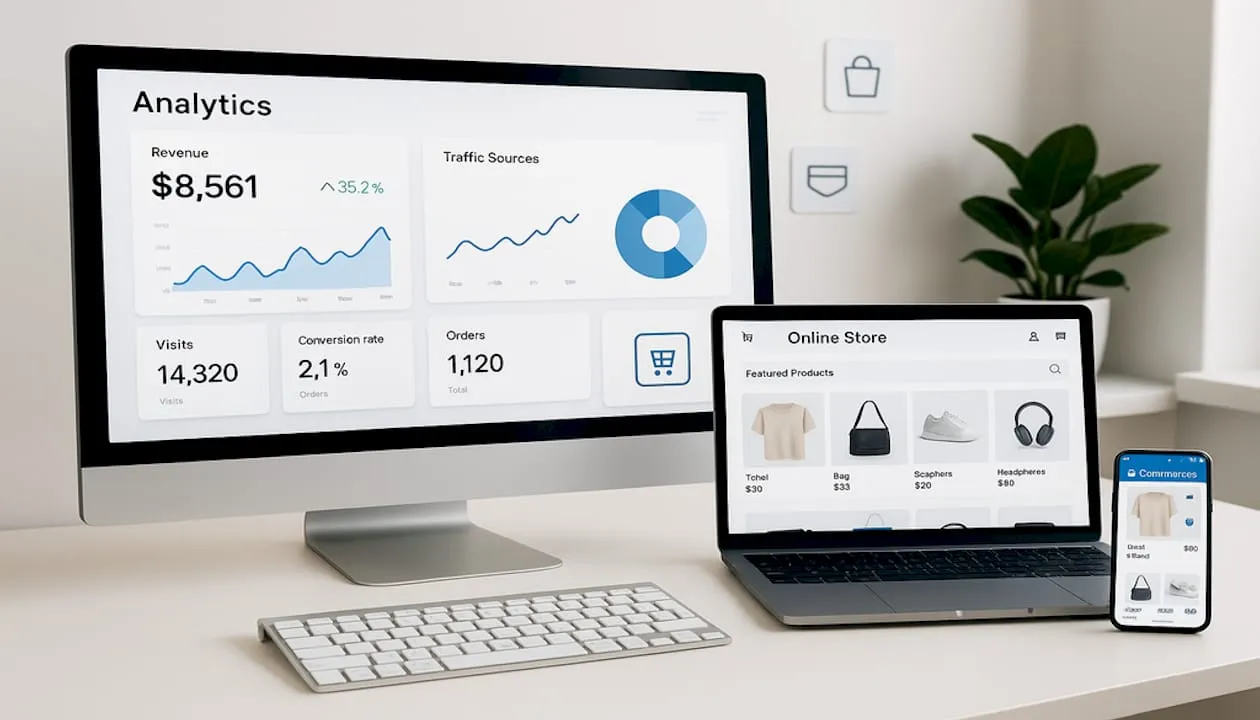
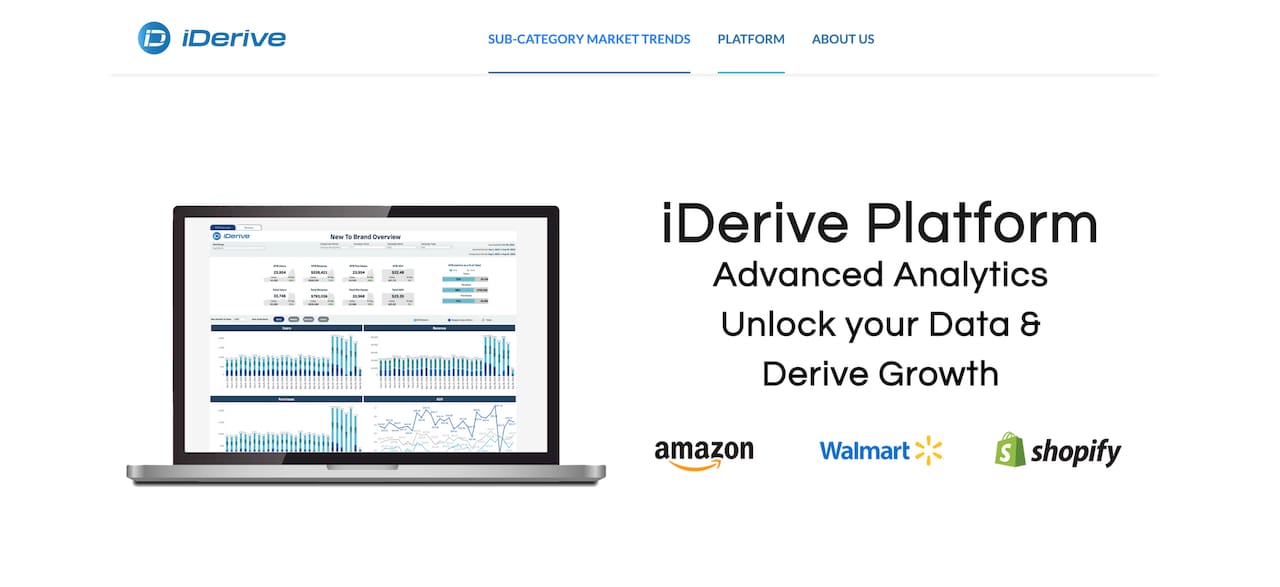
Nectar’s proprietary iDerive Analytics Platform surfaces these unit economics at the SKU level, giving brand managers a real-time view of where margin is being made and where it is leaking.
The cost drivers that quietly compress your margins
Understanding where margin goes requires mapping both fixed and variable costs by channel. Here is what that looks like in practice:
-
Amazon referral fees run 8–15% of sale price depending on category, and total platform take including fulfillment, storage, and the FBA surcharge can reach 30–45% of a product’s price before a single ad dollar
-
FBA storage fees spike during Q4 and for slow-moving inventory, making SKU velocity a direct margin variable
-
Walmart Connect fees are lower than Amazon’s in some categories, but the platform’s lower organic traffic volume means brands often need proportionally higher ad spend to drive equivalent sales
-
Shopify carries no referral fee on direct sales, but payment processing, app subscriptions, and paid traffic costs replace what Amazon extracts structurally
-
Retail media advertising already accounts for roughly 40% of what the average Amazon seller pays the platform, making it the second-largest cost line after referral fees
-
Customer acquisition cost (CAC) must be calculated per channel with marketplace-specific ceilings, not imported from your DTC site math
-
Inventory holding costs include warehouse fees, insurance, and the opportunity cost of capital tied up in slow-moving stock
-
Stockouts destroy organic rank on Amazon and Walmart, creating a margin double-hit: lost sales plus the advertising spend required to rebuild position
The most dangerous pattern is treating retail media as general marketing expense. Accurate unit economics require retail media to be part of the COGS calculation. Brands that don’t do this routinely report healthy blended ROAS while losing money at the unit level.
How to set dynamic pricing and profit floors that actually hold
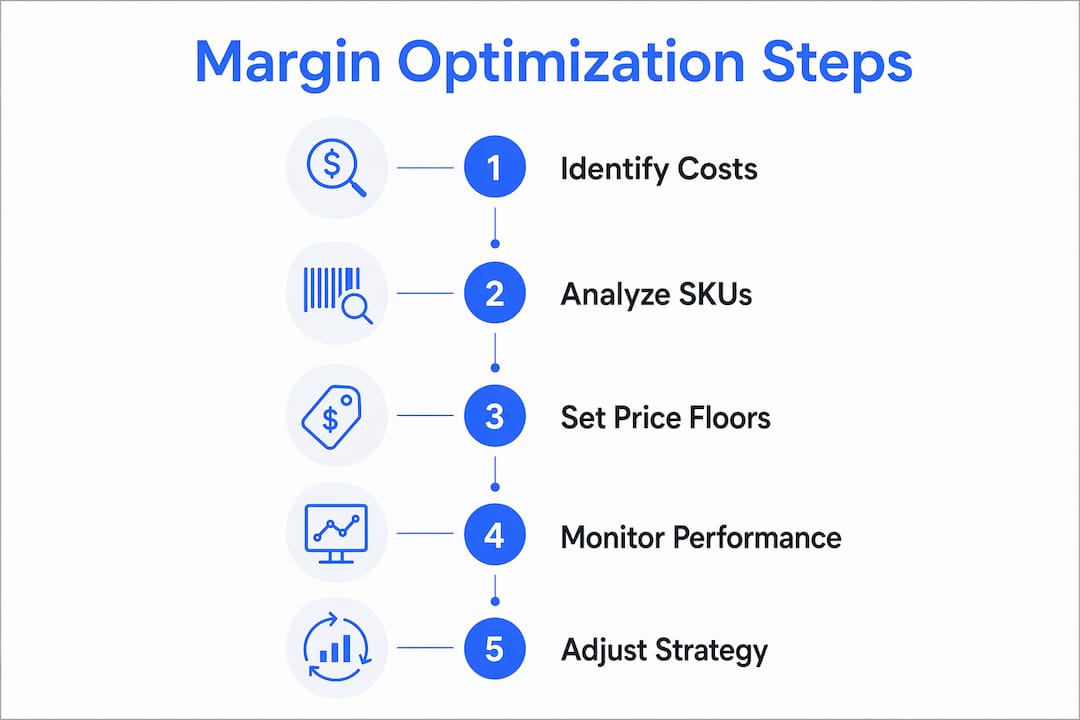
Dynamic pricing works as a margin-control mechanism when it is built around floors, not just competitive matching. Here is a practical sequence:
-
Calculate the true cost floor for each SKU. Add referral fees, fulfillment cost, storage allocation, average return rate cost, and retail media spend as a percentage of revenue. That sum is your floor. Pricing below it means selling at a loss.
-
Set automated pricing rules with hard minimums. Repricing tools should never be allowed to drop below the calculated floor, regardless of competitive pressure. A lost Buy Box is recoverable. A margin-negative sale at scale is not.
-
Segment SKUs by margin profile. High-margin hero products can absorb more aggressive retail media spend. Thin-margin SKUs need tighter bid caps and may not belong on certain channels at all. Amazon typically extracts 30–40% of revenue through fees plus advertising, which means a gross margin threshold above 65% is generally required to sustain profitability there.
-
Set SKU-level ACOS targets tied to margin, not blended averages. A hero product at 62% gross margin can support a very different ACOS ceiling than an accessory running at 38%. Most retail media platforms now support target ROAS or target CPA bidding at the SKU level. Use it.
-
Build multi-tier pricing for wholesale versus retail. Brands selling through both wholesale and direct channels need pricing logic that accounts for the different fee structures and margin expectations of each. Mixing them produces inaccurate profitability signals.
-
Gate inventory into pricing tiers. When stock levels drop below a threshold, automated rules should raise prices or suppress ads to protect remaining inventory margin and avoid stockout penalties.
-
Create internal approval workflows for pricing overrides. Exceptions happen, but they should require sign-off. Undocumented overrides are how profit floors erode over time without anyone noticing.
Pro Tip: Connect your retail media bidding automation to your inventory feed so bids suppress automatically when stock falls below a defined threshold. Running aggressive sponsored campaigns on low-inventory SKUs destroys both ROAS and organic rank simultaneously.
Using data and agency expertise to scale margin improvement
Scaling margin optimization beyond a handful of SKUs requires infrastructure: clean data, integrated systems, and people who know how to act on what the data shows.
-
Data hygiene is the prerequisite. AI-powered demand forecasting requires clean, granular SKU-level daily sales data, accurate supplier lead times, and tagged promotional events. Garbage-in forecasting produces overstock and stockout cycles that directly compress margins.
-
Run a parallel period before trusting automated forecasts. A 90-day parallel run of manual reorder alongside automated forecasts builds confidence and catches errors before they become costly inventory positions.
-
Distributed fulfillment reduces per-shipment cost. Predictive replenishment tools that position inventory closer to demand can cut costs per shipment by up to $1.40 by reducing shipping zone distances.
-
Use data visibility to negotiate better supplier terms. When you can show a supplier your sell-through rate, reorder velocity, and contribution margin per SKU, you have a factual basis for negotiating volume discounts, extended payment terms, or co-op funding. Brands that negotiate blind leave margin on the table.
-
Measure incrementality, not just reported ROAS. Retail media networks report closed-loop ROAS that systematically overstates performance. Incremental ROAS typically runs 30–60% below last-click reported ROAS. Geo holdout tests or media mix modeling tools give you the real number.
-
Build a unified KPI dashboard. Track contribution margin per SKU, LTV:CAC by channel, retail media spend as a percentage of revenue, inventory days on hand, and return rate weekly. A metric you check monthly is a metric you manage reactively.
Nectar’s iDerive Analytics Platform integrates these data streams into a single reporting layer, enabling the kind of SKU-level profitability visibility that most brands cannot build internally at enterprise scale.
Pro Tip: Treat retail media spend as COGS in your unit economics model, not as a marketing line item. Brands that fail to do this routinely report profitable blended margins while specific SKUs and channels quietly lose money.
Why retail media is now a structural margin tax
Retail media margins for the networks themselves run 70–90%, which tells you exactly how much pricing power they hold over brands. For sellers, retail media has shifted from an optional visibility tool to a mandatory cost of distribution on Amazon and Walmart.
The practical implication: your marketplace ad spend budget needs to be modeled as part of your cost structure from day one, not added after you calculate profitability. Brands that build their marketplace P&L without retail media baked in will consistently overestimate their margins and underestimate what it costs to maintain position.
Key ratios to anchor your margin model:
-
LTV:CAC of 3:1 is the viability threshold. Below it, you are acquiring customers at a loss that lifetime value cannot recover.
-
SAC must be tracked independently. Low buyer CAC combined with high supplier acquisition costs is one of the most common hidden margin drains in marketplace models.
-
Retail media as a percentage of revenue should be a standing KPI, not a campaign-level metric. When it creeps above your category’s sustainable ceiling, it is a signal to reassess channel mix or SKU selection.
Fulfillment, inventory, and channel-specific margin impacts
Fulfillment choice is one of the highest-leverage margin decisions a brand makes, and it varies significantly by channel.
-
FBA provides Prime eligibility and organic rank benefits on Amazon, but storage fees, the FBA surcharge, and long-term storage penalties can make it expensive for slow-moving or bulky SKUs
-
Third-party logistics (3PL) offers more cost control and flexibility, particularly for brands with predictable velocity and the volume to negotiate favorable rates; distributed 3PL networks reduce shipping zone distances and cut per-shipment costs meaningfully
-
Direct fulfillment on Walmart Marketplace preserves margin but requires operational infrastructure to meet Walmart’s on-time delivery requirements; late delivery fees erode margin quickly if fulfillment performance slips
-
Shopify direct-to-consumer carries no referral fee but requires brands to fund their own traffic acquisition, making ecommerce margin management on owned channels a separate discipline from marketplace optimization
-
Returns are a margin variable that most brands underestimate at the SKU level; high return-rate categories need a return cost allocation built into their profit floor calculations
-
Inventory days on hand should be optimized by SKU velocity, not managed as a single blended target; overstock on slow SKUs and stockouts on fast ones both destroy margin in different ways
Channel selection itself is a margin decision. Not every SKU belongs on every platform. Contribution margin analysis before listing, not after, is what separates brands that scale profitably from those that grow revenue while compressing margins.
How to implement dynamic pricing step by step
Turning pricing strategy into a repeatable operational process requires more than a repricing tool. Here is the sequence that works at scale:
-
Audit your current SKU margin profiles. Pull contribution margin per unit for every active SKU, including all fees, fulfillment, and retail media allocation. This baseline is what every subsequent decision references.
-
Classify SKUs into margin tiers. High-margin, mid-margin, and thin-margin SKUs need different pricing rules, different ACOS targets, and different decisions about which channels they belong on.
-
Configure automated pricing rules with floor enforcement. Set minimum prices in your repricing tool that cannot be overridden without manual approval. The floor is not a suggestion.
-
Integrate pricing rules with inventory data. When stock drops below a defined threshold, pricing rules should automatically shift to protect remaining inventory. This prevents the common pattern of advertising aggressively into a stockout.
-
Connect forecasting data to pricing decisions. If a promotional event or seasonal spike is coming, pricing rules should account for anticipated demand changes, not just current competitive positioning. A dynamic pricing strategy that ignores your own promotional calendar will misfire regularly.
-
Monitor sales velocity and advertising performance weekly. Pricing floors and ACOS targets are not set-and-forget configurations. Carrier rate changes, competitor entries, and platform fee adjustments all shift the math.
-
Document every pricing override. Exceptions create precedents. Tracking them reveals patterns, whether a particular SKU consistently requires manual intervention, which is itself a signal that the automated rules need recalibration.
Building the systems for continuous margin improvement at scale
Sustained margin improvement is an operational discipline, not a one-time optimization project. The brands that maintain healthy margins at $50M+ in marketplace revenue have built feedback loops, not just dashboards.
-
Data integration across systems is non-negotiable. Your inventory management system, retail media platform, ERP, and analytics layer need to share data in near real time. Siloed data produces siloed decisions, and siloed decisions produce margin leakage.
-
Supplier negotiations should be data-driven. Bring SKU-level sell-through rates, contribution margin trends, and volume forecasts to every supplier conversation. Brands with this visibility consistently negotiate better COGS, which is the highest-leverage cost reduction available.
-
AI forecasting requires human oversight, especially early. Clean data feeds and a parallel manual run period are prerequisites before trusting automated replenishment at scale. The cost of a forecasting error compounds through overstock fees, markdowns, and lost rank.
-
Incrementality measurement prevents wasted media spend. Every quarter, run holdout tests on your top retail media spend. The gap between reported and incremental ROAS tells you exactly how much of your ad budget is capturing demand you already created versus generating new sales.
-
Nectar’s agency model and iDerive platform are built specifically for this operational complexity. For mid-market and enterprise brands managing hundreds of SKUs across Amazon, Walmart, and Shopify simultaneously, the combination of expert channel management and unified analytics is what makes continuous improvement executable rather than aspirational.
Work with Nectar to protect and grow your margins

Margin optimization at enterprise scale requires more than a spreadsheet and a repricing tool. Nectar’s fully managed e-commerce agency services combine SKU-level profitability analysis, retail media management, and the iDerive Analytics Platform to give brand managers the visibility and execution capacity to grow profitably across Amazon, Walmart, and Shopify. If your margins are compressing and you are not sure exactly where, that is the conversation to start.
Key Takeaways
Treating retail media spend as COGS, not marketing expense, is the single most important shift mid-market and enterprise brands can make to accurately measure and protect unit-level profitability on Amazon and Walmart.
Point | Details
-
Retail media is a structural cost | Model retail media spend as COGS from day one; brands that don’t routinely overestimate their margins.
-
LTV:CAC floor is 3:1 | Below a 3:1 ratio, customer acquisition costs exceed recoverable lifetime value, making growth unprofitable.
-
Profit floors prevent algorithmic losses | Set hard minimum prices per SKU covering all fees, fulfillment, returns, and ad spend before enabling automated repricing.
-
Amazon extracts 30–45% before ads | Gross margin above 65% is generally required to sustain profitability after platform fees and advertising on Amazon.
-
Distributed fulfillment cuts per-shipment cost | Predictive replenishment tools positioning inventory closer to demand can reduce costs per shipment by up to $1.40.
Recommended











.png)