The Essential List of Advertising Metrics for 2026
.png)
TL;DR:
Effective advertising measurement requires categorizing metrics by funnel stage, from awareness to retention, to prevent misinterpretation.
Metrics like CTR indicate surface-level engagement, but true success depends on downstream conversion and long-term customer value, such as LTV and incremental ROAS.
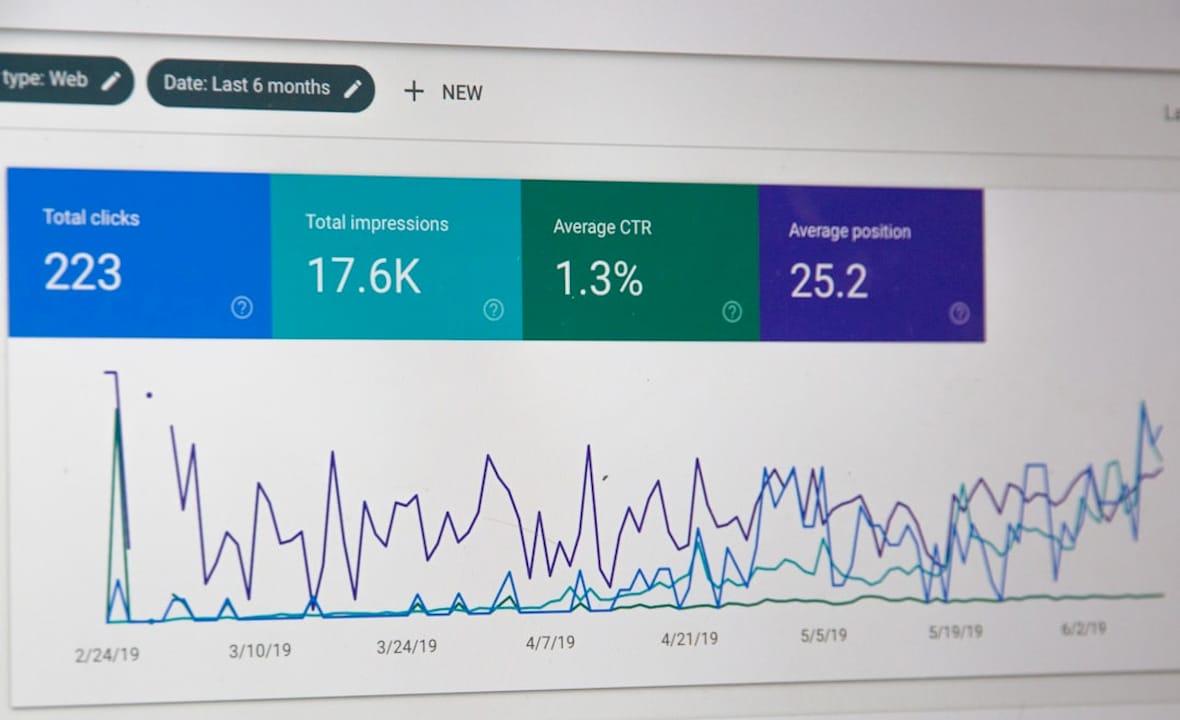
Most marketing teams drown in data long before they make a useful decision. Dashboards fill with numbers, reports multiply, and somewhere in the noise, the actual signal gets lost. The real challenge is not collecting metrics. It is knowing which ones tell you something true and what to do about it. This article cuts through that confusion with a structured list of advertising metrics organized by funnel stage, from first impression to long-term customer value, so you can measure what matters and stop optimizing for numbers that look good but mean nothing.
Key takeaways
Point | Details
-
Funnel-stage mapping: Organizing metrics by funnel stage prevents you from misreading awareness data as conversion data.
-
CTR is a signal, not a verdict: High click-through rate with low conversion rate points to a landing page problem, not ad success.
-
ROAS vs. iROAS: Platform ROAS credits all revenue; incremental ROAS isolates only the revenue your ads actually caused.
-
Retention metrics matter: LTV, repeat purchase rate, and churn tell you whether your advertising is building a business or just buying transactions.
-
Analytics events vs. conversion actions: Conflating GA4 events with ad platform conversions corrupts bidding logic and reporting accuracy.
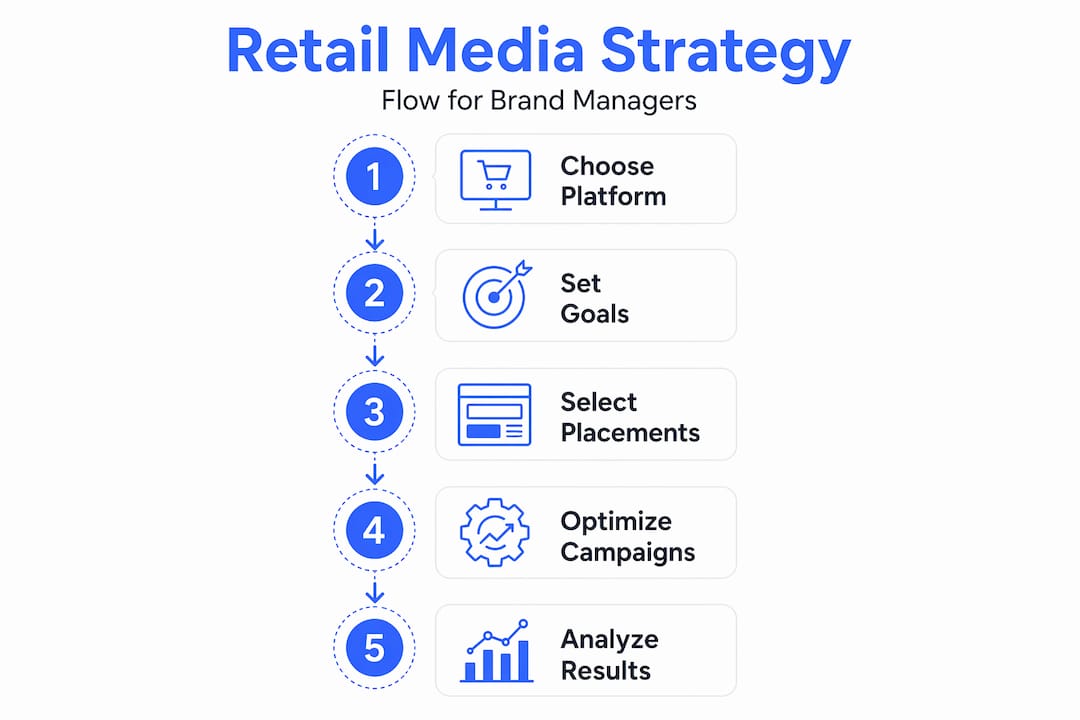
1. How to categorize advertising metrics by funnel stage
Before you build a reporting framework, you need a way to sort what you are looking at. Advertising performance indicators fall into four funnel stages, and each one answers a different question.
-
Awareness: Did enough of the right people see the ad? (Impressions, reach, frequency, CPM)
-
Consideration: Did those people engage and show interest? (CTR, clicks, video views, engagement rate)
-
Conversion: Did interested people take the action you wanted? (Conversion rate, CPA, ROAS, iROAS)
-
Retention: Did acquired customers come back and generate lasting value? (LTV, repeat purchase rate, churn, payback period)
According to funnel-stage categorization research, awareness metrics include impressions, reach, and frequency, while conversion metrics cover conversions and CPA. The mistake most teams make is pulling a single number from one stage and using it to judge the whole campaign. A campaign with high impressions and a low conversion rate is not a reach problem. It might be a landing page problem. Context comes from reading across stages together.
Pro Tip: Before you add a metric to your dashboard, ask two questions: Which funnel stage does it represent? What specific action would a bad number in this metric trigger? If you cannot answer both, leave it out.
Pairing your funnel-stage view with a full funnel marketing checklist gives you the scaffolding to audit campaigns end to end rather than spot-checking in isolation.
2. Impressions and reach
Impressions count every time your ad loads on a screen. Reach counts the number of unique people who saw it. These are not interchangeable.

A campaign with 500,000 impressions and 50,000 reach has an average frequency of 10, meaning each person saw the ad ten times. That number tells you something important: you may have maxed out your audience before maximizing your message. Ad fatigue sets in when frequency climbs without message variation, and diminishing returns follow quickly.
CPM (cost per thousand impressions) lets you compare the price of reach across channels. A $6 CPM on one platform versus $18 on another is only meaningful if the audience quality and conversion environment are comparable. Low CPM with poor audience relevance is not a bargain.
3. Click-through rate (CTR)
CTR is calculated as clicks divided by impressions, multiplied by 100. A 2% CTR means 2 out of every 100 people who saw your ad clicked it. As a creative effectiveness indicator, CTR measures whether your ad creative and headline are compelling enough to earn a click.
What CTR does not tell you is whether those clicks turned into anything valuable. High CTR with low conversion suggests problems with landing page relevance or offer clarity, not with the ad itself. Many teams celebrate a 5% CTR while missing that 95% of those clicks bounced at the product page.
Treat CTR as a diagnostic signal. It tells you whether the ad is connecting at the surface level. Conversion rate tells you whether the full experience is working. You need both to draw conclusions.
Pro Tip: If CTR is climbing but ROAS is flat, the creative is doing its job and the post-click experience is not. That narrows your testing priority to landing pages, product detail pages, and offer mechanics, not the ad itself.
For a deeper look at how creative decisions ripple into performance numbers, Nectar’s ad creative optimization guide covers the specific levers that move both CTR and downstream conversion.
4. Conversion rate
Conversion rate measures the percentage of clicks that result in a defined action, whether that is a purchase, a signup, or an add-to-cart. The formula is simple: conversions divided by clicks, multiplied by 100.
What makes conversion rate nuanced is how you define “conversion.” A 3% purchase conversion rate on a $200 product means something very different than a 3% rate on a $15 item. Volume, order value, and margin all affect how to interpret the number. Conversion rate should always be read alongside revenue data, not in isolation.
Attribution model selection also directly affects what gets counted as a conversion. Last-click attribution gives 100% of credit to the final touchpoint. Data-driven models spread credit across the journey. Switching models on the same campaign can make conversion rate appear to move dramatically without a single customer behavior changing.
5. Cost per acquisition (CPA)
CPA tells you what you paid, on average, to generate one conversion. It is one of the most direct measurements of advertising efficiency at the bottom of the funnel.
The benchmark question for CPA is whether it sits below your gross margin per order. If acquiring a customer costs $40 and your average gross profit per order is $35, you are losing money on every sale regardless of your ROAS. CPA must be evaluated against product economics, not just against itself or against channel benchmarks.
Customer acquisition cost (CAC) is the broader version of CPA. It factors in all marketing and sales costs, not just the spend on a single campaign. For brands with multiple channels running simultaneously, CAC is often the more honest number for gauging overall efficiency.
6. Return on ad spend (ROAS)
ROAS equals revenue from ads divided by ad spend. Spend $600, generate $2,400 in tracked revenue, and your ROAS is 4.0. That means $4 returned for every $1 spent. It is one of the most cited key advertising KPIs in any e-commerce reporting stack.
The problem with ROAS is that it measures correlation, not causation. If someone was already going to buy and saw your retargeting ad five minutes before purchasing, that sale gets attributed to the ad. Your ROAS looks strong. But you did not cause the purchase. You paid to take credit for it.
Top paid media KPIs for 2026 include ROAS alongside CPA, LTV, incremental lift, and revenue per click, which signals that professionals are moving beyond ROAS as a standalone metric. ROAS is a useful efficiency ratio. It is not a profitability guarantee.
7. Incremental ROAS (iROAS)
This is the metric that separates sophisticated advertisers from the rest. iROAS equals incremental revenue divided by campaign cost, where incremental revenue excludes sales that would have happened anyway without the ad.
Running an incrementality test means exposing a control group to no advertising while a test group sees your campaign. The difference in conversion rates between groups represents true lift. That lift, multiplied by revenue per conversion, gives you the incremental revenue figure.
Without this kind of testing, ROAS systematically over-credits paid channels. Branded search campaigns are the most common offenders. Someone searching for your brand by name was probably going to convert regardless. The click just happened to be the last event before purchase. iROAS exposes how much of your reported performance is real and how much is borrowed credit.
8. Customer lifetime value (LTV)
LTV measures how much revenue a customer generates across their entire relationship with your brand. The simplest version is average order value multiplied by purchase frequency multiplied by average customer lifespan.
LTV reshapes how you interpret CPA. A $60 CPA on a customer with a $300 LTV is a strong acquisition. That same $60 CPA on a one-time buyer with an $80 average order value leaves almost no margin for anything else. When you use LTV as the target metric, profitable growth through email and retention strategies becomes part of the ad measurement conversation, not a separate marketing function.
Accurate LTV requires CRM or backend data integrated with your ad reporting. Platform-reported LTV is almost always incomplete because it only sees behavior within its own ecosystem.
9. Repeat purchase rate and churn
Repeat purchase rate is the percentage of customers who buy more than once within a defined period. It directly signals whether your ads are attracting buyers who actually value the product or just buyers responding to promotions.
Churn, the inverse, tells you how many customers you are losing over time. High churn forces a brand to acquire new customers constantly just to maintain flat revenue. That constant acquisition spend inflates CPAs and suppresses profitability.
Campaigns targeted specifically at lapsed customers, using segmented messaging based on purchase history, consistently outperform broad reacquisition campaigns in both conversion rate and order value. Your CRM data makes this targeting possible. Your ad platform cannot do it alone.
Pro Tip: Track repeat purchase rate as a 90-day cohort metric. Customers who buy twice within 90 days of their first purchase have dramatically higher predicted LTV than those who take six months to return. Use this cohort as your benchmark for retention campaign effectiveness.
10. Payback period
Payback period measures how many months it takes to recover your customer acquisition cost through gross profit from that customer’s purchases. A $60 CAC with $20 gross profit per month means a three-month payback period.
This metric is especially important for brands with subscription models or high-frequency repurchase categories. A 90-day payback is very different from an 18-month payback when cash flow and growth reinvestment are on the table. Shorter payback periods allow faster reinvestment into acquisition at scale.
Connect payback period to your ad budget structure to determine how aggressively you can scale. If payback extends beyond your cash flow runway, scaling spend accelerates losses before it accelerates profits.
11. How to combine metrics for real optimization
The measurement flywheel framework integrates platform ROAS, backend CRM data, incrementality testing, and marginal ROAS into a continuous cycle. Each data source checks the others. Platform ROAS sets the baseline. Backend data reveals true profitability. Incrementality testing validates causality. Marginal ROAS guides where the next dollar of spend should go.
Optimizing a single metric in isolation is how teams win the battle and lose the war. A campaign that maximizes ROAS by cutting branded upper-funnel spend will show better efficiency numbers while slowly shrinking the audience that feeds the bottom of the funnel.
Marginal ROAS specifically asks: what does the next $1,000 of spend return, not what did the total spend return? Diminishing marginal returns are real. The first $10,000 in a campaign often produces far stronger returns than the fourth $10,000 in the same campaign targeting the same audience.
One structural issue many teams overlook: GA4 event data and ad conversion actions are not the same thing. Feeding analytics events into ad platform bidding algorithms corrupts optimization. Your bidding system needs conversion actions with accurate values, not raw behavioral events.
Pro Tip: Run incrementality tests quarterly at minimum. The results almost always reveal that at least one campaign or channel is claiming significantly more credit than it deserves. Reallocating that budget to genuinely incremental channels typically improves total portfolio ROAS within one to two cycles.
What I have actually learned about measuring ads that most articles skip
I have worked with enough brands to see the same measurement mistake repeated across industries and budget levels. Teams invest heavily in getting platform data clean and then trust it completely. That trust is the problem.
Platform metrics are reported by platforms with a financial interest in showing high performance. They are not fabricated, but they are framed. ROAS that does not account for incrementality, attribution windows that extend 30 days, and view-through conversions that count a banner impression from five weeks ago as a conversion event. All of this is technically accurate and practically misleading.
My contrarian take: CTR is one of the least useful metrics in a mature campaign’s reporting stack. It is enormously useful in the testing phase to screen creative concepts quickly. But once a campaign is running at scale, a team spending energy improving CTR from 1.8% to 2.1% is almost certainly neglecting something more important downstream.
The metric I wish more brands took seriously is iROAS, not because it is more sophisticated, but because it forces the right conversation. When you have to prove that an ad caused a sale rather than took credit for one, budget allocation becomes much more honest. I have seen brands cut 20% of their paid spend after a proper incrementality test and watch revenue hold steady because the eliminated spend was mostly capturing demand, not creating it.
The brands that win at measurement are the ones treating their ad platforms as one data source among several, not as the final word on performance.
— Dan
How Nectar helps you track and act on the metrics that matter
Nectar works with mid-sized and enterprise brands that are already running ads but cannot confidently answer whether those ads are working. The agency’s retail media capabilities cover Amazon, Walmart, and Shopify with full-funnel measurement built in, not bolted on. The proprietary iDerive analytics platform connects platform data to backend revenue, giving brands visibility into true incrementality, LTV by acquisition channel, and marginal ROAS by campaign type. If you want to see what that looks like in practice, the DSP advertising case study shows how Nectar translated better measurement into better spend allocation. Explore Nectar’s full service offerings to see where your measurement gaps are costing you.
FAQ
What are the most important advertising metrics to track?
Top paid media KPIs for 2026 include ROAS, CPA, conversion rate, incremental lift, and LTV. Which ones matter most depends on your funnel stage and campaign objective.
What is the difference between ROAS and iROAS?
ROAS measures all revenue attributed to ads divided by spend. iROAS measures only the revenue that would not have occurred without the ads, making it a more accurate indicator of true ad-driven performance.
How do you track ad performance across multiple platforms?
Effective cross-platform tracking requires a centralized analytics layer, consistent conversion definitions, and separation of platform conversion actions from analytics events. Conflating the two leads to incorrect bidding and overstated results.
Why is CTR not enough to measure campaign success?
CTR only tells you that an ad earned a click. It does not measure what happened after the click. A high CTR paired with a low conversion rate signals a disconnect between the ad promise and the landing page experience.
How does customer lifetime value affect advertising decisions?
LTV reframes CPA benchmarks by showing whether acquisition costs are sustainable over the full customer relationship. A higher LTV justifies a higher CPA and allows more aggressive scaling with confidence.
Recommended
-
Nectar Blog | Top advertising channels for e-commerce brands in 2025
-
Nectar Blog | Advertising attribution: grow your e-commerce ROI in 2026
-
Nectar Blog | Strategic Amazon Advertising: A Comprehensive Guide to Dominating the Marketplace
-
Nectar Blog | 7 Types of Digital Advertising Every E-Commerce Brand Needs


.png)


%20(1).png)