Most Amazon listings convert somewhere between 8% and 15% of sessions into orders, well above typical ecommerce averages, though the right benchmark depends heavily on category, according to Amazon Ads and cross-industry data from Statista. Nectar treats these figures as a starting point, not a verdict. Before reacting to your own numbers, compare them against your specific category and run a share-gap audit on your top ASINs.
TL;DR:
- Conversion rates vary significantly by category, with Electronics averaging 3% to 8%, while Grocery and Gourmet can reach 18% in optimal conditions.
- Mobile traffic generally converts less efficiently than desktop, making layout and content adaptation for mobile devices crucial for improving CVR.
- Campaigns with video creative see up to 67% higher click-through rates and a 9% increase in conversion rates, justifying investment in visual content.
- Sudden drops in CVR often result from negative reviews or stock issues, so monitoring fulfillment and reviews is essential before adjusting bids or content.
- Benchmark comparisons must be normalized for placement, device, price tier, and seasonality, as unadjusted data can mislead analysis of listing performance.
What conversion rate actually means on Amazon
Conversion rate, or CVR, is conversions divided by total audience, a simple ratio that gets complicated fast depending on what counts as “audience” and what counts as a “conversion.” Amazon Ads defines conversion rate this way in its own documentation, and the definition matters because two people can pull wildly different numbers from the same ASIN depending on which report they open.
There are two conversion rates that matter on Amazon, and sellers often confuse them. Ad CVR measures clicks that turn into purchases within an advertising campaign, reported inside Amazon Ads console or Sponsored Products dashboards. Listing or session CVR, sometimes called unit session percentage, measures total product page sessions (from any source, paid or organic) that end in a purchase, and it lives in Seller Central Business Reports. A listing can show a strong ad CVR while its overall session CVR lags, because organic traffic behaves differently than someone who just clicked a sponsored ad with buying intent already primed.
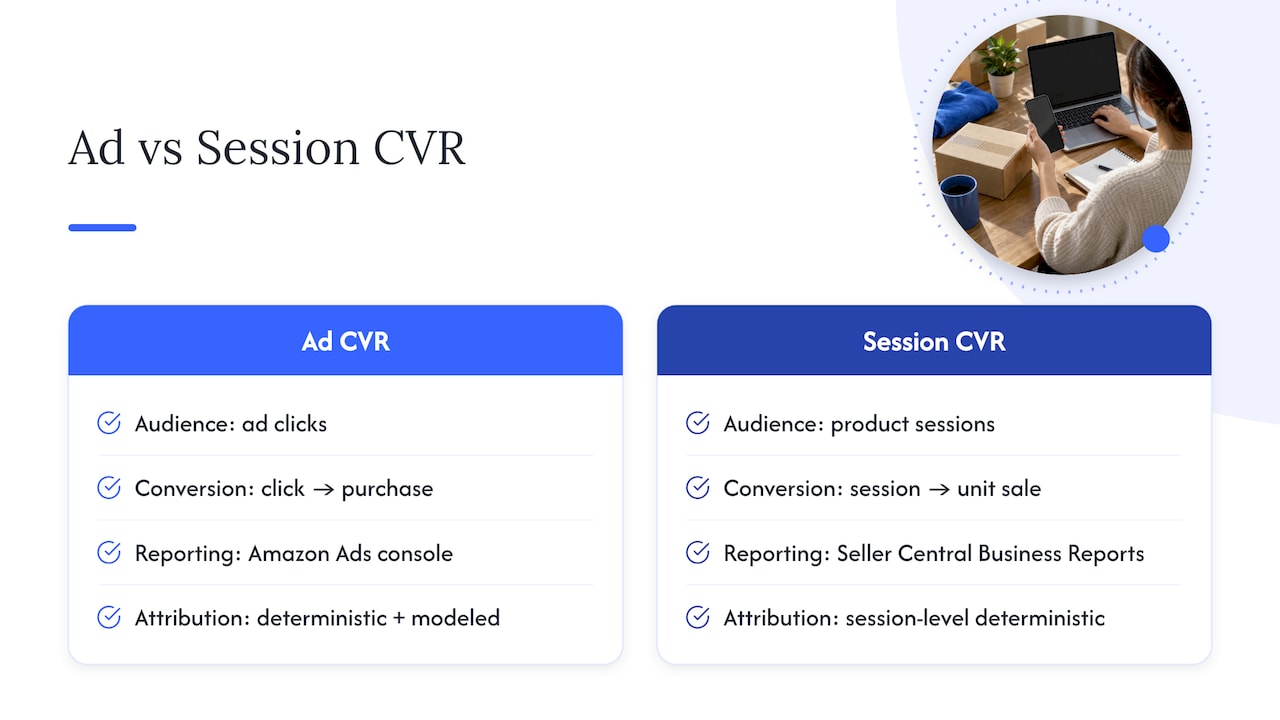
Where the numbers come from matters as much as the formula. Brand Analytics gives registered brand owners session and conversion data segmented by search term, which is the closest thing to ground truth for a specific ASIN. Amazon Ads reports layer in campaign-level conversion data, often using what the platform calls modeled conversions when a direct, deterministic match between click and purchase is not available. Third-party tools and aggregated studies, including Statista’s industry and device breakdowns, estimate broader trends but rarely capture Amazon-specific nuance the way first-party data does.
Modeled conversions deserve a plain explanation. When Amazon cannot trace a purchase back to a specific ad click with full certainty, usually because of view-through behavior or cross-device shopping, it statistically estimates the likelihood that the ad caused the sale. That estimate gets folded into the reported CVR. It is a reasonable approach, but it means the number in your dashboard is partly a model output, not a pure count, and it explains why the same campaign can show slightly different CVR figures across reporting tools that use different attribution windows or modeling assumptions.
None of this means the metric is unreliable. It means you should always know which CVR you are looking at (ad or session) and which data source produced it before you compare it to a benchmark or to last quarter’s number.
Category benchmarks: what a good conversion rate looks like by product type
Category is the single biggest lever on what “normal” looks like, more than almost any other variable. Using a single site-wide target across a multi-category catalog is one of the more common benchmarking mistakes brand managers make.
The ranges below reflect patterns commonly observed across major Amazon categories, with top performers clustering toward the higher end and average sellers landing in the middle or lower band.
- Electronics: typically 3% to 8%, with top listings reaching 10% or more when reviews are strong and price is competitive; higher price points and longer research cycles pull the average down.
- Home & Kitchen: typically 8% to 14%, a category where lifestyle imagery and bundle offers push top performers past 15%.
- Beauty & Personal Care: typically 8% to 15%, helped by repeat-purchase behavior and strong review density on hero SKUs.
- Health & Household: typically 10% to 16%, among the highest-converting categories because shoppers often know exactly what they need before they search.
- Toys & Games: typically 6% to 12%, with wide swings tied to seasonality and character or brand licensing.
- Clothing, Shoes & Jewelry: typically 4% to 10%, held down by sizing uncertainty and higher return rates that make shoppers hesitate.
- Sports & Outdoors: typically 5% to 11%, with performance-specific gear converting lower than general fitness accessories.
- Grocery & Gourmet: typically 10% to 18%, the top end of the marketplace, driven by low consideration cost and subscribe-and-save habits.
Use your own category’s range as the anchor rather than a marketplace-wide average.
Price tier shifts these numbers inside every category. High-ticket electronics and furniture behave the same way: the more a shopper has to think, the more the page, the reviews, and the price have to work to close the sale.
Device mix is the other quiet variable. Mobile sessions often make up the majority of traffic on a given ASIN but convert less efficiently than desktop, so a listing that is heavy on mobile impressions but light on desktop share may show a lower blended CVR even with strong content. That is a real pattern worth designing around: optimizing the first screen of a mobile product page, especially the title’s leading characters and the primary image, tends to matter more than desktop polish for most catalogs.
One of the more actionable findings in this space: Sponsored Products campaigns that include video creative report up to 67% higher click-through rates and 9% higher conversion rates than campaigns without video. That gap alone justifies prioritizing video production for any ASIN carrying meaningful ad spend, especially in categories like Electronics or Home & Kitchen where demonstration matters.

What actually moves conversion rate, and how to diagnose it
Conversion rate is not one lever, it is a stack of smaller ones, and the fastest way to raise it is to figure out which layer is actually broken before spending on the wrong fix.
Page content does most of the heavy lifting. The main image, title front-loading, bullet clarity, A+ Content, product video, and the density of reviews and answered questions all shape whether a session turns into a sale. A listing with a washed-out main image or a title that buries the key benefit past character 80 loses shoppers before they ever reach the bullets.
- Main image and gallery: shoppers judge quality in under a second, so a cluttered or low-contrast main image quietly caps conversion regardless of how good the copy is.
- Title structure: front-load the primary keyword and core benefit, since mobile truncates titles aggressively.
- A+ Content and video: comparison charts, lifestyle shots, and short demo videos reduce the uncertainty that stalls a purchase.
- Reviews and Q&A: review count and rating anchor trust, and unanswered questions on the page read as unresolved doubt.
Pricing and offer structure sit right behind content. Coupons and Prime eligibility change perceived value instantly, and shipping speed or a confusing return policy can quietly suppress conversion even when the product page itself looks strong.
Ad and traffic quality shape CVR just as much as the page does. Video creative, placement (top-of-search versus product pages), search term relevance, and device mix all determine whether the people landing on your page were already close to buying or just browsing. A campaign built on loosely matched keywords will always show a weaker CVR than one built on tightly mapped, high-intent search terms, no matter how good the listing is.
Operational trust rounds out the list. Fulfillment method, delivery speed promises, and a product’s historic return rate all factor into the buy box and into shopper confidence, and they are often the reason two nearly identical listings convert at different rates.
Pro Tip: When CVR drops suddenly, check reviews and price before touching the ad campaign. A single new negative review or an out-of-stock competitor undercutting your price often explains the swing faster than any bid adjustment.
How to interpret benchmarks without misleading yourself
Benchmarks are only useful if you adjust for how the underlying data was collected, and skipping that step is where most CVR comparisons go wrong.
Sample bias is the first trap. Aggregated benchmark reports often skew toward established sellers with optimized listings, which pulls the reported averages higher than what a newer catalog should expect. Lifecycle effects compound this: a brand-new ASIN with zero reviews will convert well below its category average no matter how good the images are, and that is expected, not a red flag. Seasonality adds another layer, since a toy listing measured in November will show a different CVR than the same listing measured in February. Mixing ad CVR and organic session CVR into one blended number is also misleading, since ad traffic tends to arrive with higher purchase intent already baked in.
A short normalization method keeps comparisons honest:
- Segment your data by placement (top-of-search, product page, or organic) before comparing to any benchmark.
- Split by device, since mobile and desktop sessions convert at different rates and blending them hides the real story.
- Group ASINs by price band so a $12 item is never benchmarked against a $180 item in the same category.
- Compare only within matching time windows to avoid seasonal distortion.
Small samples add noise that looks like signal. A campaign with fewer than roughly 200 to 300 clicks per period can swing several points in CVR purely from randomness, so treat any comparison built on a thin data set as directional only, not a verdict on listing quality.
A prioritized checklist to raise your conversion rate
The fastest wins come from fixing what is broken before adding anything new. Work through these in order rather than tackling everything at once.
- Run immediate fixes first: swap the main image if it lacks contrast, tighten the title’s first 80 characters, and address the top complaint in your most recent negative reviews before touching anything else.
- Upgrade creative next: add lifestyle imagery, build out A+ Content, and produce a short product video, prioritizing ASINs that already carry meaningful ad spend since video creative on Sponsored Products correlates with a 9% conversion lift.
- Audit for share gaps: use Brand Analytics Search Query Performance to find queries where your ASIN gets strong impression share but weak purchase share, since that pattern usually points to a listing or trust problem rather than a bidding problem. Our guide to boosting Amazon conversion rates walks through this in more depth.
- Test ad-specific changes: refine keyword-to-ASIN mapping so search terms match buyer intent, experiment with placement bids, and keep close attention to search relevance and title structure since mismatched traffic quietly caps CVR no matter how good the page is.
- Set a monitoring cadence: track a weekly KPI set (session CVR, ad CVR, unit session percentage, and return rate) and review completed experiments monthly so wins get scaled and losses get killed quickly.
Pro Tip: Separate every experiment into ad-only tests (click to purchase) or session-level listing tests (session to purchase), and hold the traffic source constant. Mixing the two makes it impossible to tell whether a lift came from the ad or the page.
For a more operational version of this process, our listing optimization checklist covers the same priorities across Amazon, Walmart, and Shopify catalogs.
How a managed workflow turns benchmarks into results
Running this checklist across a large catalog is a resourcing problem as much as a strategy problem, which is where a managed workflow earns its place. Nectar pairs its iDerive analytics platform with an in-house creative studio and retail media management, so share-gap audits, creative sprints, and ad optimization run on the same data instead of three disconnected spreadsheets.
The typical sequence starts with a data audit to find where impression share and purchase share diverge, moves into creative sprints that address the specific content gap (new main image, A+ Content, or video), and closes with a measurement loop that isolates whether the fix moved session CVR or ad CVR. That loop is what keeps optimization profit-first rather than spend-first. Services like retail media advertising and the full creative studio are built to plug directly into that cycle.
Segmented benchmarks by product type and price tier
Category-level ranges hide meaningful variation once you split by product type or price point within the same category. Inside Home & Kitchen, for instance, low-cost accessories like utensil sets or organizers often convert near the top of the category range because the purchase decision is low-risk, while mid-priced appliances sit lower because shoppers compare specs and reviews across several listings before buying.
The pattern holds across most categories: consumables and accessories under roughly $20 tend to convert highest, mid-tier items between $20 and $75 sit in the middle of their category’s range, and considered purchases above $75 typically land at the lower end regardless of category, simply because the buying decision takes longer.
Product type matters independently of price too. A licensed or branded item inside Toys & Games converts differently than a generic equivalent at the same price, since brand recognition shortens the decision process. When benchmarking your own catalog, group ASINs by both price band and product type before comparing them to a category average. A $15 accessory and a $150 tool in the same top-level category are not the same benchmarking problem, even if Amazon files them under the same node.
Seasonality effects on conversion rates and timing
Conversion rate is not static across the calendar, and treating a single measurement as a permanent baseline leads to bad decisions. Categories tied to gifting, like Toys & Games or Electronics, typically see conversion rates climb in the run-up to major shopping events, not just from more traffic but from higher purchase intent among the people who do show up.
The opposite happens in slower periods. Grocery and consumable categories are more stable year-round since demand does not spike around gift-giving occasions the same way.
Timing optimization means adjusting expectations and campaigns to the calendar rather than fighting it. Increase ad investment and refresh creative ahead of known demand spikes, and resist the urge to judge a listing’s health by comparing a peak-season number to an off-season one. When you do want a seasonal comparison, benchmark this year’s peak against last year’s peak, and this year’s trough against last year’s trough, never peak against trough.
How fulfillment method affects conversion rates
Fulfillment method shapes conversion rate mostly through the trust signals it carries rather than through any direct algorithmic boost. FBA listings display Prime badging, and Prime eligibility tends to raise shopper confidence because it comes with a familiar, fast, reliable delivery promise. That badge alone often nudges undecided shoppers toward a purchase, particularly for time-sensitive or gift purchases.
FBM listings can convert competitively when the seller keeps delivery promises tight and reliable, but they carry a heavier burden to prove that reliability since they lack the automatic Prime signal. A well-run FBM operation with fast, accurate shipping can close much of that gap, but it has to earn the trust that FBA gets by default.
Fulfillment method also interacts with buy box eligibility, since Amazon weighs delivery speed and reliability heavily when deciding which offer wins the buy box for a given listing. Losing the buy box removes most sellers’ shot at conversion entirely, which makes fulfillment reliability a conversion factor even before a shopper reads a single bullet point.
The buy box’s outsized effect on conversion rates
The buy box is arguably the single largest structural factor in Amazon conversion, because the vast majority of purchases happen through the default “Add to Cart” or “Buy Now” buttons tied to whichever seller currently holds it. A seller who loses the buy box on a shared listing can watch their session count stay flat while their conversion rate collapses, simply because shoppers are buying from a competing offer on the same page.
Buy box eligibility depends on a mix of price competitiveness, fulfillment method, seller performance metrics, and delivery speed, and losing any one of those can shift the box to a competitor overnight. This is why a sudden CVR drop on a multi-seller listing should always prompt a buy box check before a content audit, since the content may not have changed at all.
For brands selling through resellers or multiple accounts, buy box share should be tracked alongside conversion rate rather than treated as a separate metric. A listing that looks like it is underperforming on content might simply be losing the buy box a growing share of the time.
Using competitor analysis to put your numbers in context
A conversion rate only means something in relation to what shoppers see next to your listing, which is why competitor analysis belongs in every benchmarking exercise. If a competing ASIN in your category holds a similar price point but a meaningfully higher review count or a sharper image set, that gap explains part of the CVR difference before you touch a single word of your own copy.
Start by pulling the top three to five competing listings in your exact price band and category, not the category leader if it sits in a different price tier. Compare main images, title structure, review count and rating, and whether they use A+ Content or video, since these are the same levers covered earlier in this article. A partner resource on product seeding strategy is useful here too, since review velocity is often the biggest visible gap between a top performer and an average listing in the same niche.
Competitor analysis is diagnostic, not a copying exercise. The goal is to identify which specific factor, price, reviews, images, or badging, is most likely explaining a competitor’s higher conversion rate, then decide whether that factor is worth matching for your own catalog.
Where the ROI actually is
Most brands overspend on ad budget increases and underspend on the content and measurement work that would make that spend convert better. The higher-ROI move is almost always fixing the highest-traffic ASINs first, since a one-point CVR gain on your biggest seller outweighs the same gain spread across a dozen slow movers.
Pairing creative investment with a real measurement loop matters more than the creative itself. A new video or A+ layout without a way to isolate whether it moved session CVR or just ad CVR is a guess dressed up as a strategy. Fix measurement first, then spend on content, then scale the ad budget, not the other way around.
— Dan Katona
Turn these benchmarks into a growth plan with Nectar

Knowing your category’s benchmark is only useful if you have the resources to close the gap. Nectar’s Amazon Growth & Optimization service pairs the iDerive analytics platform with an in-house creative studio to run the exact workflow described above: share-gap audits, image and A+ Content upgrades, video production, and retail media management, all measured through one data source instead of scattered reports.
- Identify which ASINs are losing purchase share despite strong impressions.
- Rebuild main images, A+ Content, and video for the listings carrying the most traffic.
- Manage retail media spend against measured conversion lift, not just clicks.
If your catalog’s conversion rate is sitting below its category range, or you simply want a second set of eyes on where the biggest gains are hiding, request a consultation on Amazon Growth & Optimization to see where your listings stand.
Sources
- Sponsored Products - Help increase product sales | Amazon Ads
- What is Conversion Rate (CVR)? Formula and Calculation | Amazon Ads
- Global conversion rate by industry and device | Statista
FAQ
What is considered a good conversion rate on Amazon?
A good conversion rate depends on category, but many sellers treat anything above 10% as strong performance, based on the ranges Amazon Ads and industry benchmark reports commonly describe. Categories like Grocery & Gourmet or Health & Household often see higher averages than considered-purchase categories like Electronics.
What are Amazon’s conversion rates across categories?
Price tier and device mix shift these ranges further within each category.
Is 2.5% a good conversion rate on Amazon?
A conversion rate below typical Amazon category averages, which commonly run well above typical ecommerce benchmarks reported by Statista. It may be normal for a brand-new ASIN with no reviews yet, but for an established listing it usually signals a content, pricing, or trust issue worth auditing.
What is the general benchmark for conversion rate on Amazon?
There is no single marketplace-wide benchmark, since Amazon Ads defines conversion rate as conversions divided by total audience, and that ratio shifts by category, price tier, and traffic source. The most reliable approach is comparing your ASIN against its specific category range rather than a flat marketplace average.
Recommended