Why Invest in Marketplace Analytics for E-Commerce Growth
.webp)

TL;DR:
Marketplace analytics acts as decision infrastructure that improves profitability and outperforms native dashboards for e-commerce brands.
Brands that define key metrics like liquidity, net take rate, retention, and LTV/CAC see significant growth and better budget allocation results.
Building reliable data pipelines and establishing metric definitions beforehand is essential for effective, forward-looking marketplace decision-making.
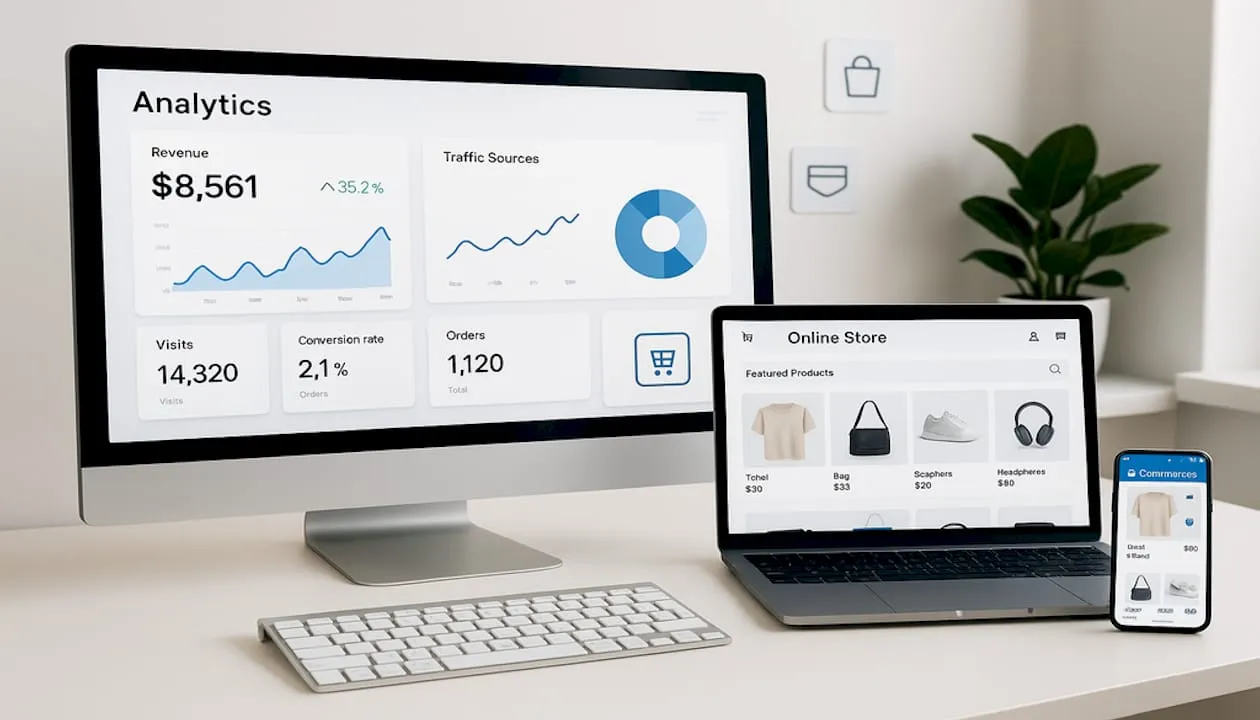
Marketplace analytics is the process of collecting, analyzing, and acting on data from online marketplaces to drive brand performance and profitability. For e-commerce brand managers running operations across Amazon, Walmart, or Shopify, the question is no longer whether to invest in analytics tools. It is how quickly you can build the infrastructure before your competitors do. Brands that treat analytics as decision infrastructure rather than a reporting afterthought consistently outperform those that rely on platform-native dashboards alone. The difference shows up in ad spend efficiency, inventory decisions, and long-term profitability.
Why invest in marketplace analytics as decision infrastructure
Marketplace analytics is not a reporting function. It is the operating system for every commercial decision your brand makes across channels. Teams in mature analytics programs track 15 to 20 specific metrics across supply health, demand quality, liquidity, and unit economics rather than relying on vanity metrics like total page views or gross sales. That specificity matters because each metric category answers a different business question.
Supply health metrics tell you whether you have enough active, quality sellers or SKUs to meet demand. Demand health metrics reveal whether buyers are finding, converting, and returning. Liquidity metrics measure how efficiently supply and demand are matching. Unit economics track whether each transaction is actually profitable after fees, returns, and fulfillment costs. Without separating these four categories, you are reading a summary when you need the full report.
The most common mistake brand managers make is treating GMV as the primary health signal. GMV can hide whether growth is coming from new supply, stronger demand, higher average order value, or better matching efficiency. Two brands with identical GMV figures can have completely different underlying economics, one growing sustainably and one quietly deteriorating.
Pro Tip: Before you build or buy any analytics stack, write out your metric definitions in plain language. If your team cannot agree on what “active buyer” means before implementation, your dashboard will optimize for the wrong thing from day one.
Which marketplace metrics actually matter for growth
The most actionable e-commerce KPIs for marketplace brands fall into four categories, and most brands are only tracking two of them consistently.
-
Liquidity rate. This measures the percentage of listed inventory that actually transacts within a given period. High liquidity signals that supply and demand are well matched. Low liquidity signals either poor product-market fit or a discovery problem. Liquidity is one of the strongest leading indicators of marketplace growth because it reflects real buyer intent, not just traffic volume.
-
Take rate net of fees. Gross revenue means little if platform fees, fulfillment costs, and return rates are eroding your margin. Net take rate gives you the true economics of each channel. Brands selling on Amazon, Walmart, and Shopify simultaneously need this metric calculated per channel, not blended.
-
Seller and buyer retention rates. Repeat purchase rate is one of the clearest signals of product-market fit. If buyers are not returning, no amount of ad spend will fix the underlying problem. Seller retention, in a marketplace context, tells you whether your supply side is stable enough to support demand growth.
-
LTV to CAC ratio. Lifetime value divided by customer acquisition cost is the single most important unit economics metric for scaling decisions. A ratio below 3:1 on any channel is a warning sign that your growth is not profitable.
Metric definitions must be locked before you build your analytics stack. Delegating that definition work to a data team without business context is one of the most expensive mistakes a brand manager can make. You end up with a technically functional dashboard that answers the wrong questions.
Review your core KPIs weekly for operational metrics like inventory levels and ad spend efficiency. Review strategic metrics like LTV/CAC and retention monthly. Quarterly reviews should focus on channel-level profitability and portfolio mix.

How analytics improves advertising budget decisions
The financial case for investing in marketplace analytics is clearest in advertising. Decision intelligence systems using Bayesian optimization outperform rolling average ROAS heuristics and deliver 18 to 24% portfolio profitability lifts. That is not a marginal improvement. For a brand spending $500,000 annually on marketplace ads, that range represents $90,000 to $120,000 in recovered margin.

The problem with traditional ROAS dashboards is structural. Reported ROAS reflects attributed revenue, not incremental revenue. When a buyer was already going to purchase and your ad simply claimed credit, your dashboard shows a win while your actual return on spend is far lower. Reported ROAS dashboards lead to misallocation because they cannot distinguish between ads that drove a sale and ads that merely accompanied one.
Bayesian and multi-armed bandit models solve this by continuously estimating the true incremental contribution of each ad placement and reallocating budget toward higher-probability outcomes in near real time. This is the difference between managing ad spend with a rearview mirror and managing it with a forward-looking model.
“Platform dashboards can be misleading. Advanced analytics close the gap between reported and true ROAS to optimize spend.” — DataGlass Labs research on Bayesian budget allocation
Unified analytics dashboards across Amazon, Walmart, and Shopify reduce manual reporting by 5 to 10 hours weekly and prevent costly stockouts by surfacing inventory signals alongside ad performance data. That time savings alone justifies the investment for most mid-sized brands, before you account for the margin improvements from better budget allocation.
For practical guidance on managing ad spend across channels, the channel-level breakdown matters more than blended totals. Amazon’s auction dynamics, Walmart’s search algorithm, and Shopify’s direct traffic behave differently. A unified view that does not segment by channel mechanics will produce recommendations that work on average but underperform on every individual platform.
Implementation challenges for multi-channel brands
Building effective marketplace analytics infrastructure is harder than buying a dashboard tool. Event tracking and data pipelines are the hardest and most critical part of the process. Without clean event data flowing from each marketplace into a central system, every metric you calculate is an approximation at best.
The most common implementation pitfalls for multi-channel brands include:
-
Fragmented data silos. Amazon Seller Central, Walmart Seller Center, and Shopify Analytics each report data differently. Without a unified data layer, your team spends hours reconciling numbers instead of acting on them.
-
Incorrect segmentation rules. Defining “new buyer” differently across channels makes retention metrics incomparable and misleads strategic decisions.
-
Underinvestment in infrastructure. Many brands buy analytics software but skip the data engineering work required to make it reliable. The result is a dashboard that looks authoritative but reflects incomplete data.
-
Vanity metric optimization. When metric definitions are unclear, teams default to tracking what is easy to measure rather than what drives decisions.
Near-real-time analytics infrastructure enables brands to act on metrics rather than simply report them. The difference between a brand that catches a stockout 48 hours before it happens and one that discovers it after losing the Buy Box is almost always an infrastructure difference, not a strategy difference.
Pro Tip: Run a metric definition workshop with your marketing, operations, and finance teams before selecting any analytics platform. Alignment on definitions is worth more than any feature set.
Traditional e-commerce analytics vs. marketplace analytics
Traditional single-brand e-commerce analytics tracks one side of a transaction: your brand selling to a buyer. Marketplace analytics must track two sides simultaneously, the supply side and the demand side, and understand how they interact.
Single-brand analytics
Single-brand direct-to-consumer analytics focuses on traffic sources, conversion rates, cart abandonment, and customer lifetime value. These metrics assume you control the full experience from ad click to checkout. They work well for Shopify DTC brands but miss the dynamics that govern performance on Amazon or Walmart.
Marketplace analytics requirements
On a two-sided marketplace, identical aggregate metrics can mask different underlying economics. Two sellers with the same monthly revenue on Amazon may have completely different liquidity rates, return rates, and seller health scores. Traditional analytics tools built for DTC do not surface these distinctions because they were not designed to separate supply-side and demand-side signals.
Marketplace-specific metrics include seller performance scores, Buy Box win rate, listing suppression frequency, and category-level liquidity. Commission rates and fee structures vary by category and fulfillment method, so net margin calculations require marketplace-specific logic that generic analytics platforms do not provide out of the box.
The importance of analytics in marketplaces comes down to this: you cannot manage what you cannot see, and single-brand tools are blind to half the picture on a two-sided platform.
Key takeaways
Marketplace analytics functions as decision infrastructure, not reporting, and brands that invest in it consistently outperform those that rely on platform-native dashboards.
Core investment rationale
Brands using decision intelligence systems see 18 to 24% portfolio profitability lifts compared to those using standard ROAS dashboards. The return on analytics investment is measurable and direct.
Metrics that drive decisions
Track liquidity rate, net take rate, buyer and seller retention, and LTV/CAC ratio. GMV alone is a misleading health signal that hides the economics underneath.
Implementation comes first
Event tracking and data pipelines must be built before dashboards are meaningful. Skipping infrastructure work produces dashboards that look useful but reflect incomplete data.
Define metrics before you build
Lock metric definitions with input from marketing, operations, and finance before selecting or building any analytics stack. Misaligned definitions produce misaligned decisions.
Unified visibility pays for itself
Cross-channel unified analytics saves 5 to 10 hours of manual reporting weekly and prevents stockouts, making the operational case for investment independent of the advertising ROI case.
The case for analytics investment is stronger than most brands realize
Most brand managers I work with underestimate how much money they are leaving on the table by relying on platform-native reporting. Amazon’s Seller Central dashboard, Walmart’s analytics portal, and Shopify’s built-in reports are designed to show you what happened. They are not designed to tell you what to do next or why the numbers moved.
The brands I have seen scale most effectively share one habit: they treat their analytics infrastructure as a capital investment, not a software subscription. They budget for data engineering, metric definition work, and ongoing model refinement the same way they budget for creative or inventory. The brands that struggle treat analytics as a cost center and wonder why their ad spend keeps underperforming.
The next frontier is agentic analytics, where AI-driven systems do not just surface insights but execute decisions within defined parameters. Bayesian budget allocation is an early version of this. The brands building clean data infrastructure today are the ones that will be positioned to deploy these systems when they mature. The brands still reconciling spreadsheets manually will be two cycles behind.
My practical advice: start with metric definitions, build your data pipelines, and then invest in the modeling layer. In that order. Skipping to the modeling layer without clean data is the most expensive mistake in the category.
— Dan Katona
How Nectar helps brands build analytics-driven growth

Nectar’s proprietary iDerive analytics platform gives mid-sized and enterprise brands the granular, channel-specific visibility that platform dashboards cannot provide. Whether you are selling on Amazon, Walmart, or Shopify, Nectar builds the analytics infrastructure, defines the right metrics for your category, and connects data signals directly to advertising and operational decisions. The result is measurable profitability improvement, not just better-looking reports. If you are ready to move from reactive reporting to proactive decision-making, explore Nectar’s full services and see how the iDerive platform translates data into margin.
FAQ
What is marketplace analytics?
Marketplace analytics is the practice of collecting and analyzing performance data from online marketplaces like Amazon, Walmart, and Shopify to inform commercial decisions. It covers both supply-side and demand-side metrics, making it distinct from standard single-brand e-commerce analytics.
Why is GMV a misleading metric for marketplace health?
GMV does not reveal whether growth is driven by new supply, stronger demand, higher order values, or better matching efficiency. Two marketplaces with identical GMV can have completely different profitability and sustainability profiles.
How does marketplace analytics improve ad spend decisions?
Advanced analytics systems using Bayesian optimization estimate the true incremental contribution of each ad placement rather than relying on reported ROAS. This approach delivers 18 to 24% portfolio profitability lifts compared to standard rolling-average ROAS dashboards.
What metrics should e-commerce brands track first?
Start with liquidity rate, net take rate, buyer retention, and LTV to CAC ratio. These four metrics cover the most critical dimensions of marketplace health and give you a foundation for every subsequent decision.
How long does it take to implement marketplace analytics properly?
The timeline depends on your existing data infrastructure. Building event tracking and data pipelines is the most time-intensive step and should be treated as a prerequisite before any dashboard or modeling work begins.
Recommended


.webp)


%20(1).webp)