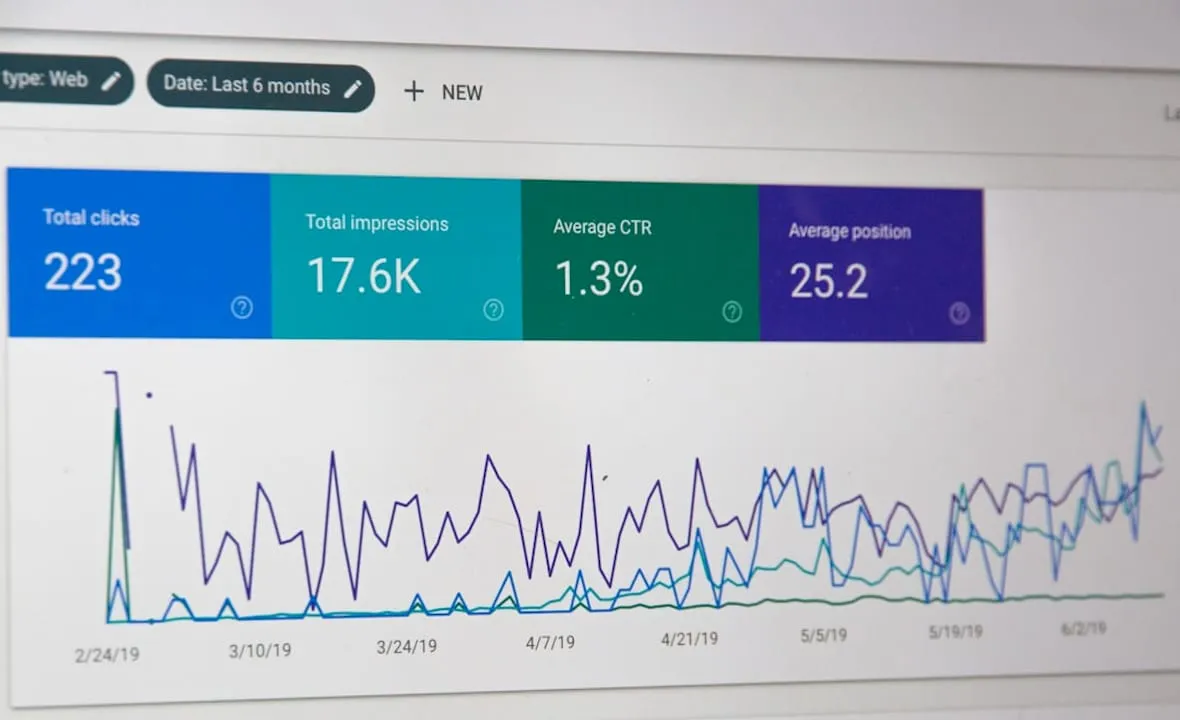
Unified ecommerce reporting means pulling sales, advertising, inventory, returns and cost data from every channel you sell on into one reporting environment, with one set of metric definitions. For a brand selling on Amazon, Walmart and its own Shopify site, it replaces three or four dashboards that disagree with each other with a single view of what is actually making money. This guide covers what to combine, which metrics to track, how to build it, and where it usually breaks.
TL;DR
- Unified reporting puts marketplace, D2C, advertising and fulfillment data into one environment, with shared definitions for revenue, margin, conversion and ROAS.
- It is not the same as unified commerce. Unified commerce is an operating architecture, while unified reporting is the measurement layer on top of whatever systems you run.
- The hard part is rarely the dashboard. It is metric definitions, SKU mapping, cost data and attribution rules.
- Start with profit by SKU and channel, then add advertising, inventory and customer data in stages.
- Validate every feed for freshness, duplicates and nulls, and assign an owner to each report.
What unified ecommerce reporting actually means
Most brands that sell in more than one place already have reports. Seller Central has its own. Walmart Seller Center has its own. Shopify has its own. Each one uses its own definition of a sale, a session, a conversion and an ad-attributed order. Adding them up in a spreadsheet gives you a number, but not one you can defend in a budget meeting.
Unified reporting fixes that by connecting the sources into one place. Industry descriptions of the category agree on the basics: modern analytics platforms consolidate data from sales channels, marketing platforms and operational systems so nobody has to gather it by hand. For brands on marketplaces, that includes SKU-level visibility into sales, margin, inventory and campaign performance.
The word “unified” carries three requirements:
- One place. Every channel’s data lands in the same environment.
- One language. Revenue, units, returns and profit mean the same thing everywhere.
- One grain. You can move from brand to channel to SKU without the numbers changing.
If any of the three is missing, you have a collection of dashboards, not unified reporting.
How it differs from unified commerce and separate channel reports
Search results for this topic are crowded with “unified commerce” content, and the two terms get mixed up. They solve different problems.
Unified commerce
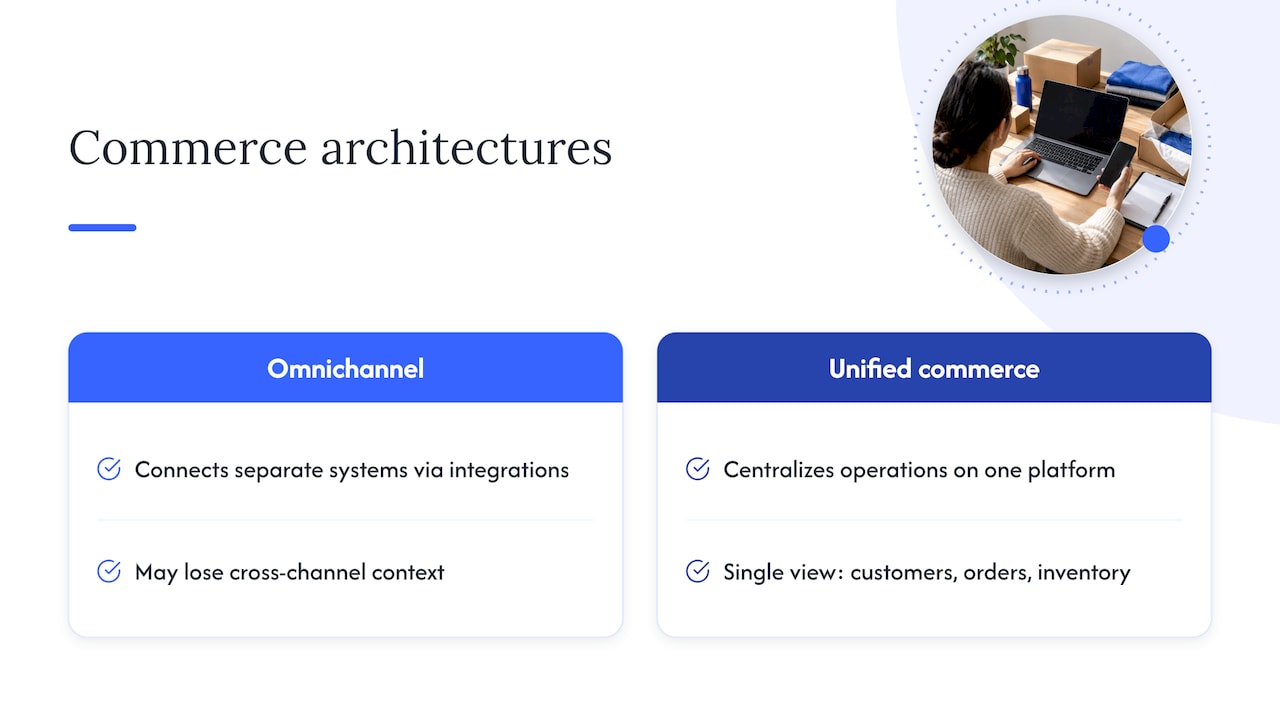
Unified commerce is about architecture. Shopify draws the line between omnichannel, which connects separate systems through integrations, and unified commerce, which centralizes retail operations on a single platform. TCS’s research with US retail executives says it brings critical data into a centralized platform, giving a single view of customers, transactions, orders and inventory. The NRF notes that without it, retailers can lose context and continuity when shoppers move between channels.
That is a platform decision. It mostly concerns retailers running stores, warehouses and a website on one stack.
Unified reporting
A brand selling through Amazon and Walmart cannot put those marketplaces on its own commerce platform. Amazon and Walmart own the storefront, the customer relationship and much of the data. Unified reporting works around that. It does not change where you sell. It changes how you see the results.
Separate channel reports
Channel-native reports are accurate within their own walls and useful for daily work. The trouble starts when you compare them. Attribution windows differ, “sales” may include or exclude tax and shipping, and returns post on different timelines. Treat them as inputs to the unified view, not as the view.
The problems unified reporting solves
The value is in the decisions it makes possible, not in the dashboard.
- Budget allocation. A unified view of channel performance is the foundation of mix-shift decisions, and without it brands decide with incomplete information. Should the next $100,000 go to Amazon sponsored ads, Walmart Connect or paid social driving to your site? You cannot answer that from three separate ROAS figures.
- Profit, not just revenue. Advertising metrics alone mislead. Intentwise’s CEO, in an Amazon Ads piece, argues that optimizing ads well means bridging ad metrics with retail factors such as inventory levels and product profitability. A campaign with a strong ROAS on a low-margin SKU that is about to stock out is not a win.
- Inventory and ad coordination. Spending to drive traffic to a SKU with three weeks of stock wastes money. Ad and inventory data side by side prevents it.
- One story for leadership. When the CFO, the Amazon lead and the D2C lead all quote the same revenue and margin, meetings get shorter.
What data to bring together
Start from the decisions, then work back to the data. A practical unified model includes orders, inventory, advertising data, customer data, shipping and fulfillment events, returns, COGS and other variable costs, because together they let you calculate profitability by product and channel.
Sales and orders
Orders, units, gross and net revenue, discounts, and taxes by channel and SKU. This is the backbone. Amazon’s documentation shows how broad the source data is: its report types cover inventory, orders, returns, performance, settlement, FBA, tax and business reports. Settlement data matters most for finance, since it shows what you were actually paid after fees.
Advertising
Spend, impressions, clicks, attributed sales and ROAS for every ad platform: Amazon sponsored ads and DSP, Walmart ads, Google, Meta and others. Walmart offers click, units sold and sales insights for traffic driven from external sources through its Sales Rewards and Attribution program, which helps tie off-marketplace spend to marketplace results.
Product and inventory
On-hand units, inbound units, days of cover, stockouts, and the Buy Box rate. Inventory is the data most often left out of marketing dashboards, and the one that most often explains a sudden sales drop.
Returns and costs
Returns by reason and SKU, COGS, fulfillment fees, storage fees and shipping. Without these, you can report revenue but never real contribution margin.
Customer data
Marketplaces limit what you can see about buyers, so customer-level analysis is strongest on your own site. Even so, multi-platform reporting should ideally let you calculate customer lifetime value across Shopify and marketplace purchases where the data allows it. Be realistic about what each marketplace shares.
Metrics a unified report should track
Keep the first version small. These are the metrics that earn their place.
Channel level
- Gross and net revenue by channel
- Contribution margin by channel after fees, ad spend, fulfillment and returns
- Total advertising cost of sales (TACoS), meaning ad spend divided by total sales, not just ad-attributed sales
- Refund and return rate
SKU level
- Units, revenue and margin per SKU per channel
- Days of inventory cover and stockout days
- Conversion rate and Buy Box share
- Ad spend as a share of the SKU’s sales
A good system lets you drill down from a channel overview to a single SKU’s performance across every marketplace. If you cannot do that, you will keep exporting to spreadsheets.
Advertising level
Walmart sellers get metrics such as click-through rate, conversion rate, cost per click and ROAS in Seller Center reports. Pull those alongside Amazon’s equivalents, but note that each platform defines attribution differently. Standardize the definitions, document them, and show platform-reported and normalized figures side by side until the team trusts the gap.
Our perspective
After working across Amazon, Walmart and Shopify programs, we see the same pattern. Brands rarely lack data. They lack agreement on what the data means. Teams buy a dashboard tool, connect the feeds in a week, and then spend months arguing about whose number is right.
We build reporting the other way around. First we write down the questions the business needs answered: which SKUs deserve more ad dollars, which channel earns its margin, where stock will run out. Then we define the metrics, then we connect the sources. Our iDerive platform exists for this: unified marketplace data, reported in business language, with advertising measured on profit and on incrementality rather than platform-reported ROAS alone.
Two habits matter most. Put profit at the center, because revenue-first reporting rewards the wrong behavior. And keep creative, advertising and operations in the same conversation, because a conversion drop might come from a listing image, a stockout or a bid change, and you only find which by looking at them together.
— Dan Katona
How to build unified reporting, step by step
1. Define decisions and metrics first
List the five to ten decisions the report must support, then write a one-line definition for every metric. Decide whether revenue is net of returns, whether tax is included, and which attribution window you use for ads.
2. Inventory your sources
Typical sources are the Amazon Seller Central or Vendor Central APIs, the Walmart Seller API, the Shopify Admin API, Google Analytics 4 and each ad platform. One 2026 description of a marketplace dashboard lists these APIs with refresh rates from real time to hourly. Pick a refresh rate by decision: ad bidding needs fresher data than monthly margin review.
3. Respect source limits
Platforms limit how long data stays available. Amazon states that report retention varies by type and defaults to 90 days when none is specified, after which a report can be generated again. Store your own history in a warehouse so you are not dependent on what a platform still has.
Amazon also notes that its Selling Partner API lets brands programmatically access granular data on orders, shipments and payments, which is what makes retail-aware ad optimization possible.
4. Centralize and standardize
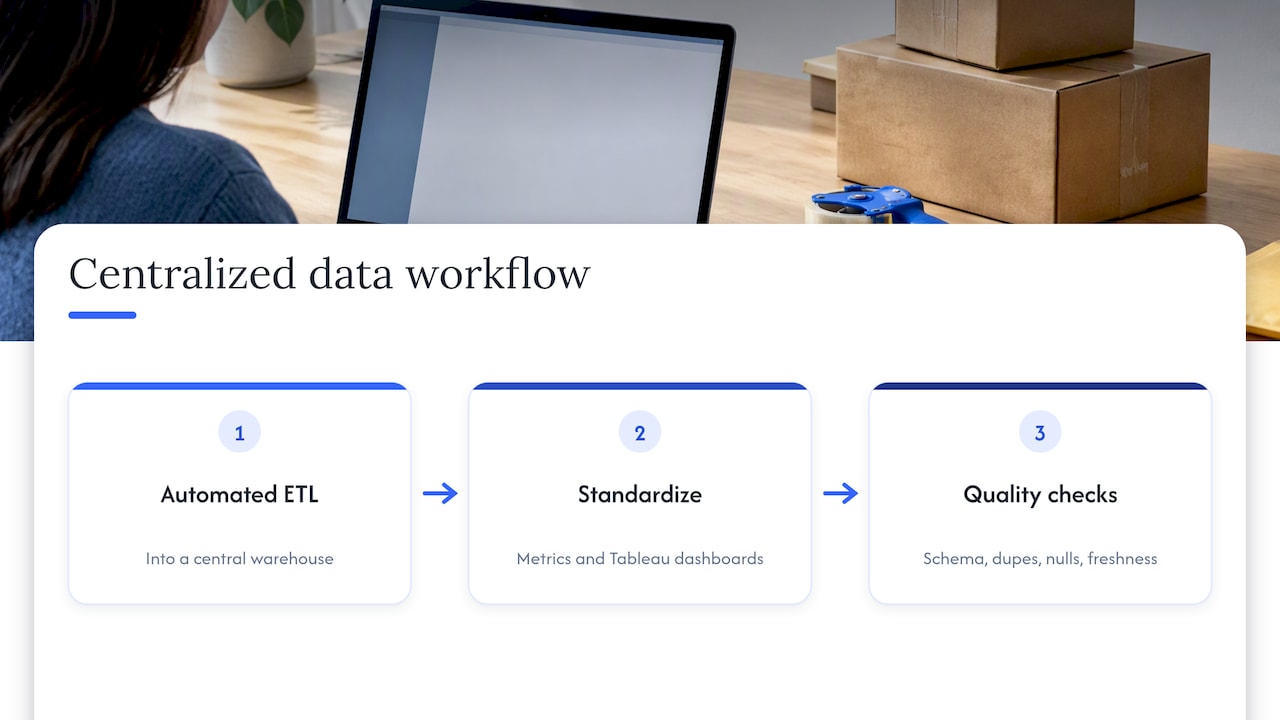
A documented case study of unifying data across 75 brands used automated ETL into a central warehouse, standardized metrics and Tableau dashboards, with quality checks for schema, duplicates, nulls and data freshness. That sequence is a sound template whatever tools you use.
Shopify’s guidance for modern commerce stacks points the same way: API-first design and a unified data layer where products, orders and inventory resolve to one authoritative record. Your product master, with one ID mapping ASINs, Walmart item IDs and Shopify variants to the same SKU, is the most valuable asset in the project.
5. Add attribution
Once sales and costs reconcile, bring in marketing. One nutrition brand case showed that moving to a single Power BI environment enabled unified attribution across Google, Meta and Amazon Ads. Attribution will never be perfect, so add incrementality tests for your biggest budget lines. Our advertising and incrementality analytics work is built for that question.
6. Validate before you publish
Reconcile each channel’s total against its native report and against finance. Check for duplicate orders, null SKUs, late data and timezone mismatches. Do it again on a schedule, not once.
7. Assign owners and review cadence
Every metric needs a named owner, and every report a review rhythm: daily for ads and inventory, weekly for channel performance, monthly for profit and mix. When a Shopify store syncs with an ERP, real-time synchronization lets you manage inventory without manual entry. Reports are only as good as the discipline behind them.
Challenges to expect
- Attribution gaps. Marketplaces report ad sales on their own terms, and off-platform traffic is only partly visible. Use platform data as an input, not the verdict.
- Mismatched identifiers. The same product has an ASIN, a Walmart item ID and a Shopify variant. Without a clean mapping, SKU-level reporting fails.
- Missing costs. COGS and fee data often sit in finance systems. Without them, the report overstates profit.
- Timing differences. Returns, settlements and ad attribution post at different speeds, so yesterday’s number will change.
- Access and permissions. API credentials, Vendor Central versus Seller Central, and agency access all need setting up and maintaining.
- Over-building. A report nobody uses is worse than none. Shopify experts suggest judging architecture investments by CFO-reviewed metrics such as total cost of ownership, not broad KPIs. Apply the same test to your dashboards.
Where Nectar fits
If your team is stitching exports together every month, we can take that over. Our iDerive analytics platform unifies marketplace data across Amazon, Walmart and your own site, and our team manages the advertising, operations and creative work that the numbers point to. You can also see how we approach Amazon growth and optimization or talk to us about Walmart and Shopify programs. Pricing is scoped to your catalog and channels, so there is no published rate card.
For more background, our piece on the role of analytics in ecommerce growth goes deeper on turning data into return.
FAQ
What is unified ecommerce reporting?
It is reporting that combines data from every sales channel, ad platform and operational system into one environment with shared metric definitions. It lets a brand compare Amazon, Walmart and D2C performance on the same terms, down to the SKU.
Is unified ecommerce reporting the same as unified commerce?
No. Unified commerce is an operating architecture that runs channels on one platform and one data record. Unified reporting is a measurement layer, and it works even when you sell on marketplaces you do not control.
Which data should I connect first?
Start with orders, fees, returns and COGS so you can see profit by SKU and channel. Add advertising next, then inventory and customer data. Each step should answer a specific decision before you add more.
How often should the data refresh?
Match the refresh rate to the decision. Ad bidding and inventory alerts benefit from daily or hourly updates, while margin and channel mix reviews work fine weekly or monthly. Keep your own history, since platforms limit how long reports stay available.
Sources
- Stop Juggling 5 Dashboards: Unify Your Data (PayHelm)
- Omnichannel vs. Unified Commerce (Shopify)
- Unified commerce: the key to orchestrating modern customer journeys (TCS)
- Meeting the challenges of unified commerce (NRF)
- Marketplace vs. D2C: Leveraging Platform Data (42signals)
- Advice on how to increase ad spend efficiency (Amazon Ads)
- Building a Marketplace Analytics Dashboard (Ecosire)
- Amazon Selling Partner API report types
- Walmart Marketplace toy brand case study
- Multi-Platform Ecommerce Reporting guide (Trivas)
- Ecommerce Reporting & Analytics (Linnworks)
- Walmart Marketplace SEM case study
- Amazon vendor reports FAQ
- Unifying Media and eCommerce Performance Insights Across 75 Brands
- Enterprise Architecture Challenges in Commerce (Shopify)
- Multi-Channel Analytics for a DTC Nutrition Brand (CorrDyn)
- Unified Commerce at Scale: Shopify and NetSuite
Recommended