Walmart forecasts demand for every item in every store, every week, and your replenishment, fill rates and scorecard results follow from those numbers. Brands that treat the forecast as an input to their own planning, instead of a number that simply arrives, keep shelves in stock and avoid costly excess. At Nectar, we manage Walmart marketplace operations for mid-market and enterprise brands, including the inventory and forecasting work that sits behind it. This guide explains how Walmart’s forecasting works, based on what its own engineers have published, and how to build a supplier routine around it.
TL;DR
- Walmart forecasts weekly demand for roughly 500 million U.S. store-item combinations, looking up to 52 weeks ahead.
- The forecast blends sales history, holidays, promotions and, more recently, weather, macroeconomic and online behavior signals, then gets adjusted within the week when sales run hot or cold.
- Suppliers see two views of it: what Walmart expects to sell (Store Demand Forecast) and what it expects to order from you (Order Forecast).
- The winning move is a weekly routine: compare Walmart’s numbers with your own sell-through, supply and promotion plans, and resolve gaps before they become out-of-stocks or OTIF misses.
How Walmart builds its forecast
Walmart’s forecasting team generates weekly forecasts for more than 500 million item-by-store combinations in the U.S., projecting 52 weeks ahead. The purpose is practical: send each store the right amount of product (the engineers’ example is how many strawberries each store needs), improve in-stock rates and cut food waste.
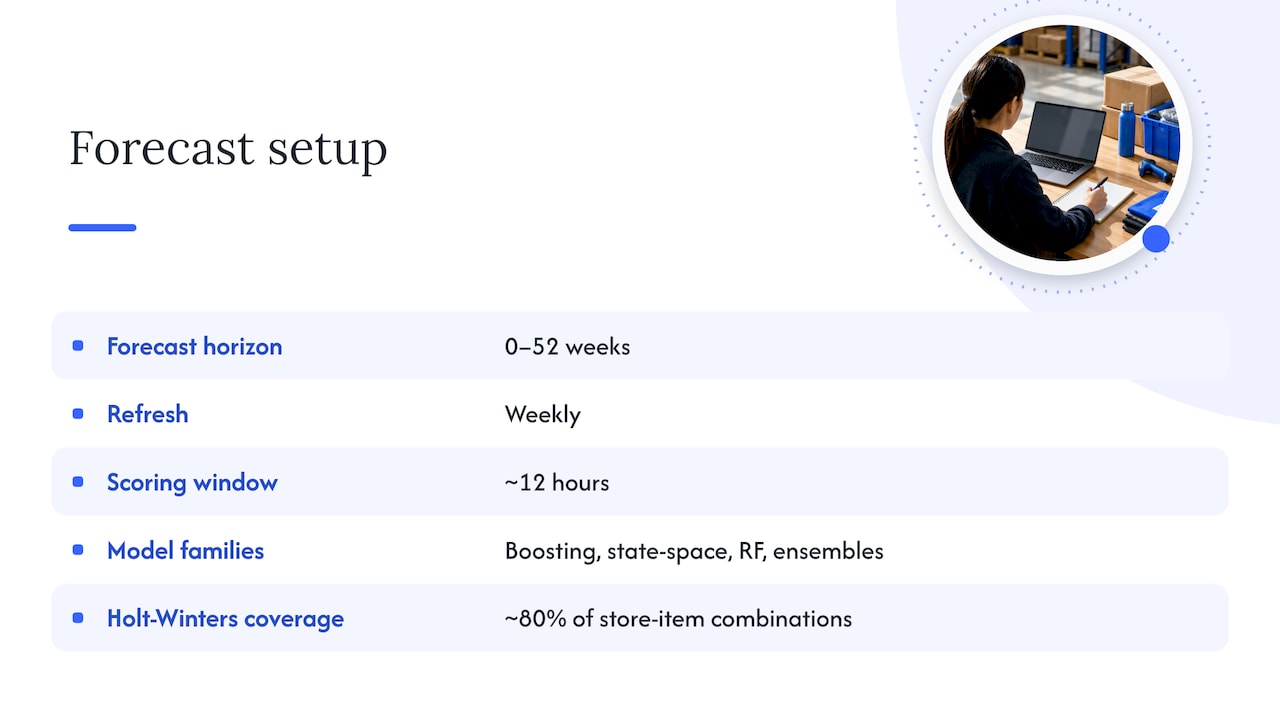
According to a 2019 presentation by Walmart Labs, the forecast covers a 0 to 52 week horizon and is refreshed weekly, with a scoring window of roughly 12 hours. The same presentation lists the model families in use: gradient boosting, state-space models, Random Forests and ensembles that combine them. At that time, the older Holt-Winters system (a classic statistical method that projects trends and seasonality) still covered about 80% of store-item combinations while the newer models were rolled out.
The older approach had a clear weakness. A 2020 Walmart Global Tech write-up explains that it forecast national demand and then allocated it to stores by recent market share, which missed local spikes. The example given is chayote squash in New Orleans at Thanksgiving. The newer platform builds separate model tracks and forecasts closer to the store level.
What this means for you: Walmart does not forecast by brand or by category average. It forecasts your item in each store, so local patterns, store openings and regional events all move the numbers you see.
What data goes into the forecast
Walmart has disclosed a fair amount about its inputs over the years. The public picture looks like this:
- Sales history and lags. A 2019 post on Walmart’s Random Forests models describes store features (location, size, days since opening), date features, event uplift features and lag features, trained on seven years of sales history.
- Holidays, promotions and benefits calendars. The Walmart Labs presentation lists lagged demand, holidays and U.S.-wide events, promotions and SNAP (the federal food assistance program) among the inputs.
- Local context. Walmart’s Demand Workbench, described in a 2019 post, lets planners adjust forecasts for factors like local weather, demographics, nearby events and planned promotions.
- Future data. In a 2023 post, Walmart SVP Parvez Musani describes pairing historical data with macroweather patterns, macroeconomic trends and local demographics to place holiday items across distribution centers, fulfillment centers and stores.
- Online behavior. Retail Brew reported in October 2023 that Walmart’s inventory software was adding inputs such as ad click-throughs, website traffic and search behavior, with inflation factored in.
That last point matters for brands that run retail media. Search interest and traffic can feed demand signals, so ranking, content and advertising work on Walmart.com is connected to the forecast, not separate from it. Our guides on improving Walmart rankings and Walmart keyword targeting cover the demand-generation side.
Demand sensing: how the forecast changes inside the week
A weekly forecast has a built-in lag. Walmart’s own engineers note that the weekly model cannot use the most recent weekend sales, because data processing starts after Friday data lands. To close the gap, they built an In-Week Adjustments layer, which grew out of a produce manager’s manual weekend sales correction tool.
Here is how it works, per the 2020 Walmart Global Tech description:
- On Monday morning, weekend sales are compared with the weekly forecast.
- Item-stores selling above 110% of forecast are flagged as overselling, and those below 60% as underselling.
- Linear models adjust the Tuesday to Friday forecasts, within replenishment business rules.
The reported result was an improvement of more than 40 basis points in weekly accuracy for produce, and more than 70 basis points at the seasonal shoulders of items like strawberries. A basis point is one hundredth of a percentage point, so these are meaningful gains at Walmart’s scale.
This is called demand sensing: short-horizon correction based on the latest sales, as opposed to demand forecasting, which projects further out. For a supplier, the lesson is that a spike or a dip in a given week can change what Walmart orders within days. A promotion that overperforms on Saturday can show up as a larger order request by midweek.
How much better are the models?
Walmart has shared a few accuracy results, and they show the direction of travel:
- The 2020 platform write-up reports that a 52-week backtest of the new machine learning platform showed about 300 basis points of accuracy improvement over the legacy systems.
- Datanami’s 2019 coverage of the Walmart Labs presentation reports a 1.7% increase in forecast accuracy against a prior commercial system, and says Walmart’s in-house approach beat three of four external vendor solutions in a request for proposal.
- A 2026 academic study using Walmart weekly sales data from 45 U.S. stores over 182 weeks found that a hybrid of time-series, machine learning, deep learning and hierarchical methods reached an R² of 0.99, and frames forecasting as decision support for replenishment, safety stock, distribution and workforce planning.
The takeaway for a brand is not the model type. It is that Walmart’s forecasts are built to be acted on, and they keep getting more granular. The brands that do well are the ones that respond to them quickly.
The two forecasts suppliers see
Through Walmart’s Scintilla analytics environment, suppliers get two primary datasets, as SPS Commerce’s Supply Chain Source explains:
- Store Demand Forecast: what Walmart expects to sell to customers through stores in the coming weeks. It draws on about two years of historical sales, adjusted for non-recurring events, modular changes and store-count changes, and it is the basis for replenishment planning.
- Order Forecast: what Walmart expects to order from you. It builds on the demand projection and factors in store inventory position, markdown strategies and safety-stock changes.
Both datasets include forecast quantities, scheduled arrival dates and order lead times, which makes them usable for aligning production and shipping. The report-pulling guide notes that the Store Demand Forecast report requires a Forecast Walmart Week filter, while the Order Forecast report requires a Suggested Order Date filter.
The reason to read them closely is the scorecard. Deviations from the supply plan can affect OTIF (on-time, in-full) results, and suppliers are expected to review Retail Link and Scintilla data weekly or even daily.
A weekly forecasting routine for Walmart suppliers
This is the routine we would hand a brand manager or ecommerce lead. At each step, the work is easy to describe and hard to keep up across hundreds of SKUs.
- Pull both forecasts every week. Export the Store Demand Forecast and Order Forecast at SKU level, with the quantities, arrival dates and lead times. The failure point is cadence: a forecast reviewed monthly is already stale, given that Walmart refreshes weekly and adjusts within the week.
- Compare against actual sell-through. Line up last week’s forecast against what sold, by item. Look for the pattern Walmart’s own demand sensing looks for: items selling well above or well below plan. Treat a sustained gap as a signal, not noise.
- Overlay your own calendar. Add promotions, retail media bursts, new item launches, price changes and seasonal peaks. Walmart’s models use promotions and holidays as inputs, but they only know what has been planned and entered. Our piece on how seasonality shapes ecommerce strategy helps with this step.
- Check supply against the Order Forecast. Test whether your production, inbound shipments and lead times can hit the scheduled arrival dates. This is where OTIF problems begin, usually weeks before the missed delivery.
- Set inventory targets by forecastability. Items with steady demand can run lean. Volatile items need more cover. Our post on making weeks of inventory work with forecastability walks through the logic.
- Raise the discrepancies. When your view and Walmart’s differ, bring evidence to the buyer or planner conversation: sell-through, promotion plans, lead-time changes. The collaborative planning process exists for exactly this.
- Close the loop. After each peak or promotion, record what the forecast got right and wrong, and feed that back into next quarter’s plan.
Our Forecasting and Retail Readiness capability covers inventory planning and analytics for brands on this routine, and the operations and retail readiness analytics view of our iDerive platform is built around demand forecasting.
Planning for peaks: what Walmart’s holiday system tells you
Walmart’s recent behavior shows what it wants from supply at peak. Retail Brew reported that Walmart began developing its inventory management software in 2019 and designed the current system to avoid repeating the 2021 overstock. Musani’s team describes a system connected to 4,700 stores, fulfillment centers, distribution centers and suppliers, with engines that find and correct discrepancies in supply chain models before customers shop.
Musani also stressed execution over endless planning. In his words to Retail Brew, at some point you have to stop planning and get into execution, with nimbleness. For suppliers, that translates into three habits for the fourth quarter and other peaks:
- Lock the base plan early so Walmart’s long-range forecast reflects your real expectations.
- Hold flexible capacity or inbound options for the items most likely to outsell.
- Watch the in-week signals and be ready to expedite or rebalance, instead of waiting for the next monthly review.
The same logic applies to seasonal advertising. Spend that drives demand without inventory to match it wastes budget, and inventory without demand ties up cash. Our article on optimizing seasonal campaigns for ecommerce ROI addresses how to coordinate the two.
Where Nectar fits
Forecasting on Walmart touches inventory, catalog, advertising and content at once, and the signals sit in different places. We run fully managed e-commerce services for mid-market and enterprise brands, including end-to-end marketplace operations covering catalog, inventory, forecasting and compliance, plus retail media buying and a proprietary analytics platform, iDerive, for unified reporting. That lets one team read the forecast, the sell-through and the ad plan together.
If you are selling on Walmart and want forecasting handled as part of a managed program, start with our Walmart solutions page or our marketplace operations management capability.

Brands that also sell on Amazon or their own site can bring those channels under the same plan through marketplace expansion and management.
Our perspective
Most brands treat Walmart’s forecast as something that happens to them. It lands in a portal, someone glances at it, and the real planning happens in a separate spreadsheet that nobody at Walmart sees.
We think that gap is the main source of avoidable out-of-stocks. Walmart’s forecast is built from the same signals you control: promotions, content, search visibility, advertising and price. When those are planned in isolation, the forecast and your supply plan drift apart.
Our approach is to bring those inputs into one view. Our iDerive analytics platform is designed to unify marketplace data so that inventory, advertising and sales sit side by side, and our teams manage operations, creative and retail media together. The aim is a forecast conversation with the buyer that starts from your evidence, with a supply plan that already matches it.
The brands that grow on Walmart are not the ones that predict perfectly. They are the ones that notice a gap in week one and fix it by week two.
Dan Katona
FAQ
Does Walmart share its demand forecast with suppliers?
Yes, in part. Through Scintilla, suppliers can see the Store Demand Forecast, which is what Walmart expects to sell, and the Order Forecast, which is what it expects to order from them. Both carry quantities, scheduled arrival dates and lead times, and they are meant to be used for production and shipping plans.
How far ahead does Walmart forecast?
Walmart’s published engineering material describes weekly forecasts for 0 to 52 weeks ahead for each U.S. item-store combination. The near-term weeks are refined further by in-week adjustments based on the latest sales.
What data does Walmart use to forecast demand?
Publicly disclosed inputs include sales history, lagged demand, holidays, promotions, SNAP benefit timing, store attributes, and, in newer systems, weather, macroeconomic trends, local demographics, and online behavior such as search and traffic. Walmart has not published a complete list, so treat the disclosed inputs as a guide, not a full specification.
How can a brand improve its results against Walmart’s forecast?
Review the forecasts weekly, compare them with your actual sell-through and promotion calendar, and confirm that your supply and lead times can meet the Order Forecast. Raise discrepancies early with your Walmart contacts. Strong content, search visibility and advertising also help, because online behavior is among the signals Walmart is adding to its models.
Sources
- Daily demand sensing enhancements for weekly forecasting models, Walmart Global Tech
- How Walmart Improves Forecast Accuracy with NVIDIA GPUs
- Building a Machine Learning based demand forecasting platform, Walmart Global Tech
- Random Forests for store forecasting at Walmart scale
- Pillars of Walmart’s Demand Forecasting
- Decking the aisles with data: Walmart’s AI-powered inventory system
- How Walmart predicts holiday demand, Retail Brew
- How Walmart Uses Nvidia GPUs for Better Demand Forecasting, Datanami
- Data-Driven Demand Forecasting for Retail Decision-Making
- Replenishment 301: Avoiding Walmart Out-of-Stocks
- What is Supply Planning?
- How to Pull Reports for Demand Forecasts
- What is CPFR? Collaborative Planning, Forecasting, and Replenishment
Recommended