Retail media incrementality is the share of your sales, new customers or other results that happened because of your ads and would not have happened without them. It is the question your attributed ROAS cannot answer: of the sales a sponsored listing gets credit for, how many would have landed anyway? This guide explains how to measure it, which test designs fit which decisions, how to read incremental lift and incremental ROAS, and where the measurement breaks down.
TL;DR
- Incrementality is the gap between what happened with your ads and what would have happened without them. Attributed sales and ROAS show only the first half.
- Retail media sits right next to the point of purchase, so it is especially prone to claiming sales that were already coming.
- Credible tests need a control group, clean exposure and sales data, and enough time to separate lift from noise. Holdouts, geo experiments, matched markets and synthetic controls are the main designs.
- Incremental lift is the percentage gain over baseline. Incremental ROAS is incremental sales divided by ad spend. Use both to move budget, not just to report.
- Start with the decision you need to make, then pick the lightest test that can settle it.
What incrementality means in retail media
Incrementality measures the part of a campaign’s results that would not have happened without the ads. Industry bodies frame it as a causal question: did the advertising cause the outcome, or did it merely sit in front of a shopper who was going to buy anyway?
In retail media, an incremental sale is a purchase by an exposed shopper that goes beyond the baseline of what that shopper (or a comparable group) would have bought with no ad. The baseline is the key idea. It is never directly observed, so every incrementality method is really a way of building a believable estimate of it. The IAB and IAB Europe guidelines for incremental measurement in commerce media call this a credible counterfactual.
What counts as incremental
Three kinds of outcomes are worth separating:
- Incremental sales: units or revenue above the baseline in the exposed group.
- Incremental new-to-brand customers: buyers who would not have discovered or purchased your brand without the ad.
- Incremental halo: sales of other products in your catalog, or at other retailers, that the campaign influenced.
The flip side is cannibalization: ads that move a shopper from one of your products to another, or from an organic listing to a paid click, add cost without adding revenue. In a July 2025 to March 2026 campaign, Bumble Bee used Amazon Marketing Cloud cross-product association modeling to confirm zero cannibalization of existing products while pursuing likely buyers of its Snackers line. That is the kind of check most brands never run.
Why attributed sales and ROAS are not enough
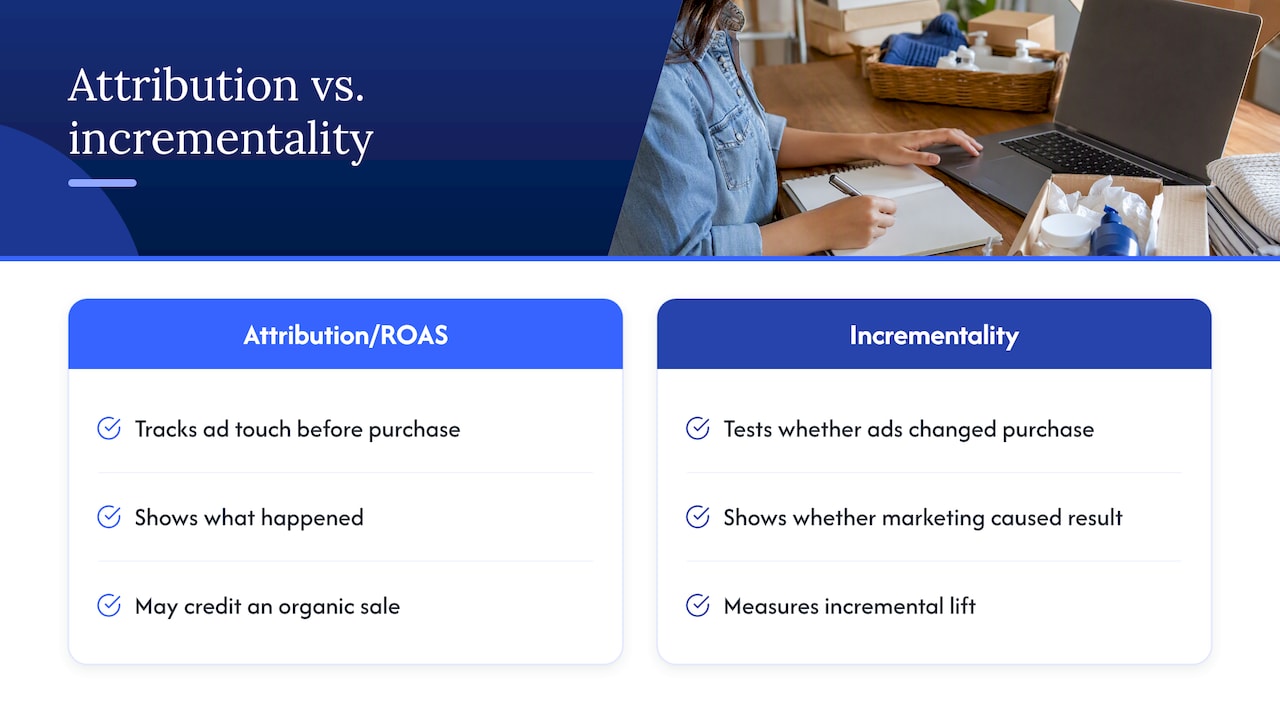
Attribution tells you which ad touched a shopper before a purchase. It does not tell you whether the ad changed the purchase. The IAB guidance puts it plainly: attribution and ROAS show what happened, not whether marketing caused the result.
Retail media makes this gap wider than in most channels. The ad appears on the retailer’s site, often on a search results page, a few clicks from checkout. As eMarketer has noted, that proximity makes it easy for a sale that would have happened anyway to be routed through a sponsored listing, which is why brands need to look beyond ROAS and measure incremental lift.
The classic example is branded search. A shopper types your brand name into Amazon, clicks your sponsored result and buys. Your dashboard records a sale at a healthy ROAS. But that shopper was already looking for you. If you had not bought the ad, your organic listing would probably have captured most of the sale. The ad was a toll booth, not a driver of demand.
For a deeper look at how credit assignment works and where it misleads, see our post on attribution versus incrementality.
Where each method fits
None of these tools replaces the others. Think of them as answering different questions:
- Attribution and platform ROAS: daily optimization signals. Fast, granular, biased toward the last touch.
- Incrementality experiments: causal evidence for a specific tactic, such as a campaign type, audience or retailer.
- Marketing mix modeling (MMM): long-term, aggregate effects across all business drivers, including price, promotion and offline media.
The IAB guidance describes MMM as capturing long-term aggregate effects while experiments give granular causal evidence for specific tactics. Mature teams run all three and use experiments to calibrate the other two.
How to test whether your ads caused the sales
Every incrementality test compares a treatment group that sees ads against a control group that does not. The IAB guidelines list the main designs: randomized controlled trials, holdouts or ghost ads, matched markets, and synthetic control groups. Here is how each plays out in retail media.
Audience holdouts and randomized tests
You randomly split eligible shoppers into two groups and suppress ads for one. Because assignment is random, the groups are statistically alike, and any difference in purchases is attributable to the ads. This is the gold standard when the retailer or your measurement environment supports it. On Amazon, tools like Amazon Marketing Cloud let advertisers build exposed and unexposed audiences from their own campaign data. Our team covers this in detail on our page about AMC and incrementality testing.
Retailers are also building measurement into their ad products. Walmart Connect, for example, has introduced incremental sales measurement for Sponsored Search, aimed at answering whether you are driving more sales than you would without advertising. Check the retailer’s current documentation for eligibility and availability, since these programs change.
Geo experiments and matched markets
When you cannot randomize individual shoppers, you randomize places. You turn ads off, or on, in selected regions or store trade areas and compare against similar regions. This works especially well for retail media that drives in-store sales. A usable geo readout has three parts: a lift figure, a confidence level and a defined test window.
Synthetic controls and SKU-level holdouts
Synthetic control builds a weighted blend of untreated units (stores, regions, or SKUs) that tracks your treated unit closely before the test, then uses that blend as the baseline afterward. SKU-level holdouts are a lower-cost cousin: you pause advertising on a subset of comparable products and compare their sales trajectory against products that stayed live. Both need a clean pre-period so the comparison is fair.
Pausing and re-launching as a rough check
Some teams simply pause a campaign for a couple of weeks and watch total sales. It is better than nothing for branded terms, but it is easily confused by seasonality, promotions, stock-outs and competitor moves. Treat it as a smoke test that tells you whether a proper experiment is worth the investment.
What a reliable test requires
The IAB guidance boils reliability down to three things: a credible counterfactual, controls for bias, and enough repeated measurement to distinguish lift from noise. In practice, that translates into a short checklist.
- A decision attached to the test. “Should we cut branded sponsored search by 30%?” is testable. “How good is our advertising?” is not.
- Comparable groups. Randomization is best. Otherwise match on pre-test sales, seasonality, price and distribution.
- Clean, linked data. The IAB and MRC retail media guidelines stress the consistent and verifiable linkage of exposure and sales data to limit selection bias and model errors.
- Enough volume and time. Small SKUs with a handful of daily orders produce noisy results. Estimate your minimum detectable effect before launching, so you know whether the test can see the lift you care about.
- A stable environment. Avoid changing price, promotions, creative or inventory in the test window. If you must, document it.
- Pre-agreed readout rules. Decide the metric, the confidence threshold and the action before you see the data.
How long should a test run?
There is no universal answer. Short-consideration, low-ticket items can read out faster. For high-ticket products with long consideration phases, a post-treatment observation window helps capture sales that lag the ad exposure. Set duration from your purchase cycle and volume, not from a calendar slot.
Reading incremental lift and incremental ROAS
Two numbers come out of most tests.
- Incremental lift: the percentage increase in the outcome over the baseline. If the control group would have produced 1,000 sales and the exposed group produced 1,050, lift is 5%.
- Incremental ROAS (iROAS): incremental sales divided by ad spend. If those 50 extra sales were worth $2,500 and the ads cost $1,000, iROAS is 2.5.
These figures are illustrations of the arithmetic, not targets. What matters is the comparison with platform ROAS. A campaign reporting 6.0 ROAS and delivering 1.5 iROAS is still adding sales, but it is far less efficient than the dashboard suggests, and the right response depends on your margins.
Turn the number into a budget decision
- Compare iROAS with your break-even. Use contribution margin after product cost, fees and fulfillment, not revenue alone.
- Look at the confidence interval. A 4% lift with a range of 0% to 8% is a different story from 4% with a range of 3% to 5%.
- Segment before generalizing. Branded and non-branded search, new and existing customers, hero SKUs and long-tail SKUs often behave very differently.
- Retest after big changes. Incrementality is not permanent. Pricing, competition and retailer ad formats shift it.
Our post on ROI maximization for mid-market and enterprise marketers goes further on how to reallocate spend once you have the numbers.
Limits and pitfalls across retail media networks
Incrementality is powerful but not frictionless. The IAB guidance lists the common obstacles: the cost and time required to set up controls, data contamination, model bias and data-quality issues, and results obscured by noise or insufficient data.
Contamination and small samples
If shoppers in your control group still see your ads through another channel or another retailer’s network, the gap between groups shrinks and you underestimate lift. If your test is underpowered, you may see no effect where one exists. Both errors lead to bad decisions, so be careful about reading a flat result as proof that ads do nothing.
Sales beyond the retailer’s own site
Retail media works across the funnel and across channels. When Amazon’s Omnichannel Metrics were applied to Serta Simmons Bedding, they revealed that 62% of its display ad-driven sales occurred beyond Amazon. The IAB and MRC guidelines likewise say measurement should ideally extend beyond immediate on-site transactions to account for a halo of brand awareness and shifts in buying behavior across other channels and retailers. If you only count on-platform conversions, you will undercount some campaigns and overcredit others. Our guide to cross-channel attribution in ecommerce covers the measurement side.

Foundations most brands lack
NIQ makes a pointed observation: the definition of incrementality is widely agreed, but almost no brand has the foundation required to measure it accurately. That foundation is mostly unglamorous: consistent product and campaign naming, unified sales data across retailers, clean pre-period history and a team that agrees on the metrics.
Walled gardens and inconsistent methods
Each retailer measures differently. Definitions of new-to-brand, attribution windows and lift methodology vary, and you generally cannot audit the retailer’s models. The practical answer is to run your own tests where you can, use retailer-provided tools where you cannot, and compare results on a common scale (iROAS and lift against a defined baseline) rather than on each platform’s native ROAS.
How to choose an approach for your brand
Match the method to the decision and its stakes.
If the decision is small and reversible
Testing a bid strategy or a campaign type? A SKU-level holdout or a pause-and-compare check is usually enough. Move fast, accept wider error bars.
If the decision moves meaningful budget
Shifting a large share of spend between retailers or between sponsored ads and upper-funnel formats deserves a randomized or geo-based design with a pre-set power calculation and a clear read-out rule.
If you sell through multiple retailers and channels
You need a unified view: sales and spend data from Amazon, Walmart and your own site in one place, with experiments feeding a model that updates your allocation. This is where one-off tests become a program.
A sensible sequence for most brands:
- Audit your current reporting. Which numbers drive budget decisions today, and what do they actually measure?
- Rank your campaigns by spend and by suspicion. Branded search and retargeting are the usual first suspects.
- Run one well-designed test on the highest-stakes question.
- Reallocate based on the result, then retest in the next planning cycle.
- Fold results into your planning model so every quarter starts smarter.
Our perspective on incrementality
We manage retail media for mid-market and enterprise brands, and the same pattern shows up in account after account: spend follows the metric that looks best, and the metric that looks best is usually the one that takes the most credit. Branded terms, retargeting and bottom-funnel placements post impressive ROAS because they sit closest to the sale. That does not make them bad. It makes them a place where you need proof before you scale.
Our view is profit-first. Incrementality is only useful if it changes what you do with the budget, so we pair experiments with business-language readouts: what we tested, what lift we saw, what it is worth after margin, and what we recommend you do next. That is what our iDerive analytics platform is built for, putting marketplace data in one place so tests, reporting and decisions use the same numbers instead of three versions of the truth.
We also push back on the idea that you must choose between attribution and experiments. Attribution is how you run campaigns day to day. Experiments are how you check that the day-to-day signals are pointing in the right direction. Brands that treat them as a system, rather than a debate, make better calls about where the next dollar goes.
— Dan Katona
Put incrementality to work with Nectar
If you want a measurement program rather than a one-off test, our team can design and run it alongside your retail media management. We combine retail media advertising across Amazon and Walmart with advertising and incrementality analytics in iDerive, so test results flow directly into bidding, budgets and creative decisions.

To discuss your account, start at thinknectar.com and tell us which spend you most want proven.
FAQ
What is the difference between incrementality and attribution?
Attribution assigns credit for a sale to the ads a shopper touched. Incrementality asks whether the sale would have happened without those ads. A campaign can win a lot of attributed credit and still add little, especially when it targets shoppers who were already about to buy.
Is a high ROAS the same as high incrementality?
No. ROAS divides attributed revenue by spend, and attributed revenue includes sales that would have occurred anyway. Incremental ROAS divides only the extra sales caused by ads by spend. The two can diverge sharply, particularly on branded search and retargeting.
How much does an incrementality test cost?
The direct cost is usually the media you withhold or shift, plus analyst time and any tool fees. The IAB guidance names cost and time to establish controls as a real challenge. Starting with a SKU-level holdout on a single campaign type keeps the cost modest while you learn.
Can small brands run incrementality tests?
They can, but low order volume makes results noisy, so lift has to be large to be detected. Estimate the minimum detectable effect first. If your volume cannot support it, use longer test windows or aggregate across similar products.
How often should I retest?
Retest after major changes in pricing, competition, creative, distribution or retailer ad products, and revisit your highest-spend tactics at least once per planning cycle. Results describe a moment, not a permanent truth.
Sources
- IAB and IAB Europe: Guidelines for Incremental Measurement in Commerce Media
- IAB/MRC Retail Media Measurement Guidelines
- eMarketer: Why advertisers and retailers need to pay attention to incrementality in retail media
- Amazon Ads: Bumble Bee case study
- Amazon Ads: Serta Simmons Bedding Omnichannel Metrics case study
- Walmart Connect: incremental sales measurement for Sponsored Search
- NIQ: Measure Retail Media Incrementality and Prove Impact
Recommended