What the Fastest-Growing Amazon Brands Do Differently With Ads

Most Amazon ad accounts look healthy on ROAS while the business underneath them stays flat. After roughly 100 account audits in the past 12 months, here is what the fastest-growing Amazon brands do differently with measurement, retail readiness and every ad dollar they spend.
Key Takeaways
- Measure the business, not the campaign. ROAS can look excellent while organic sales, new-to-brand customers and market share all move the wrong way.
- Use SQP and AMC together. Search Query Performance shows your share of each search term. Amazon Marketing Cloud shows which ads actually preceded a purchase.
- Fix the detail page before buying more traffic. Ads amplify the retail experience you already have. Stock, Buy Box, content and reviews decide how much of that traffic converts.
- Test your branded spend. Cut branded spend 15%, watch branded purchase share in SQP, and move what you don't need into category terms.
- Stop paying for search terms that never convert. In the accounts we audit, 20% to 60% of spend goes to search terms with zero orders.
- Fund fewer ASINs harder. Spreading budget across 30 products and hundreds of keywords rarely sells enough on any one term to lift organic rank.
🎥 Watch the Full Session: Want to see the complete breakdown? You can check out the full recording for our webinar session here: What the Fastest-Growing Amazon Brands Do Differently.
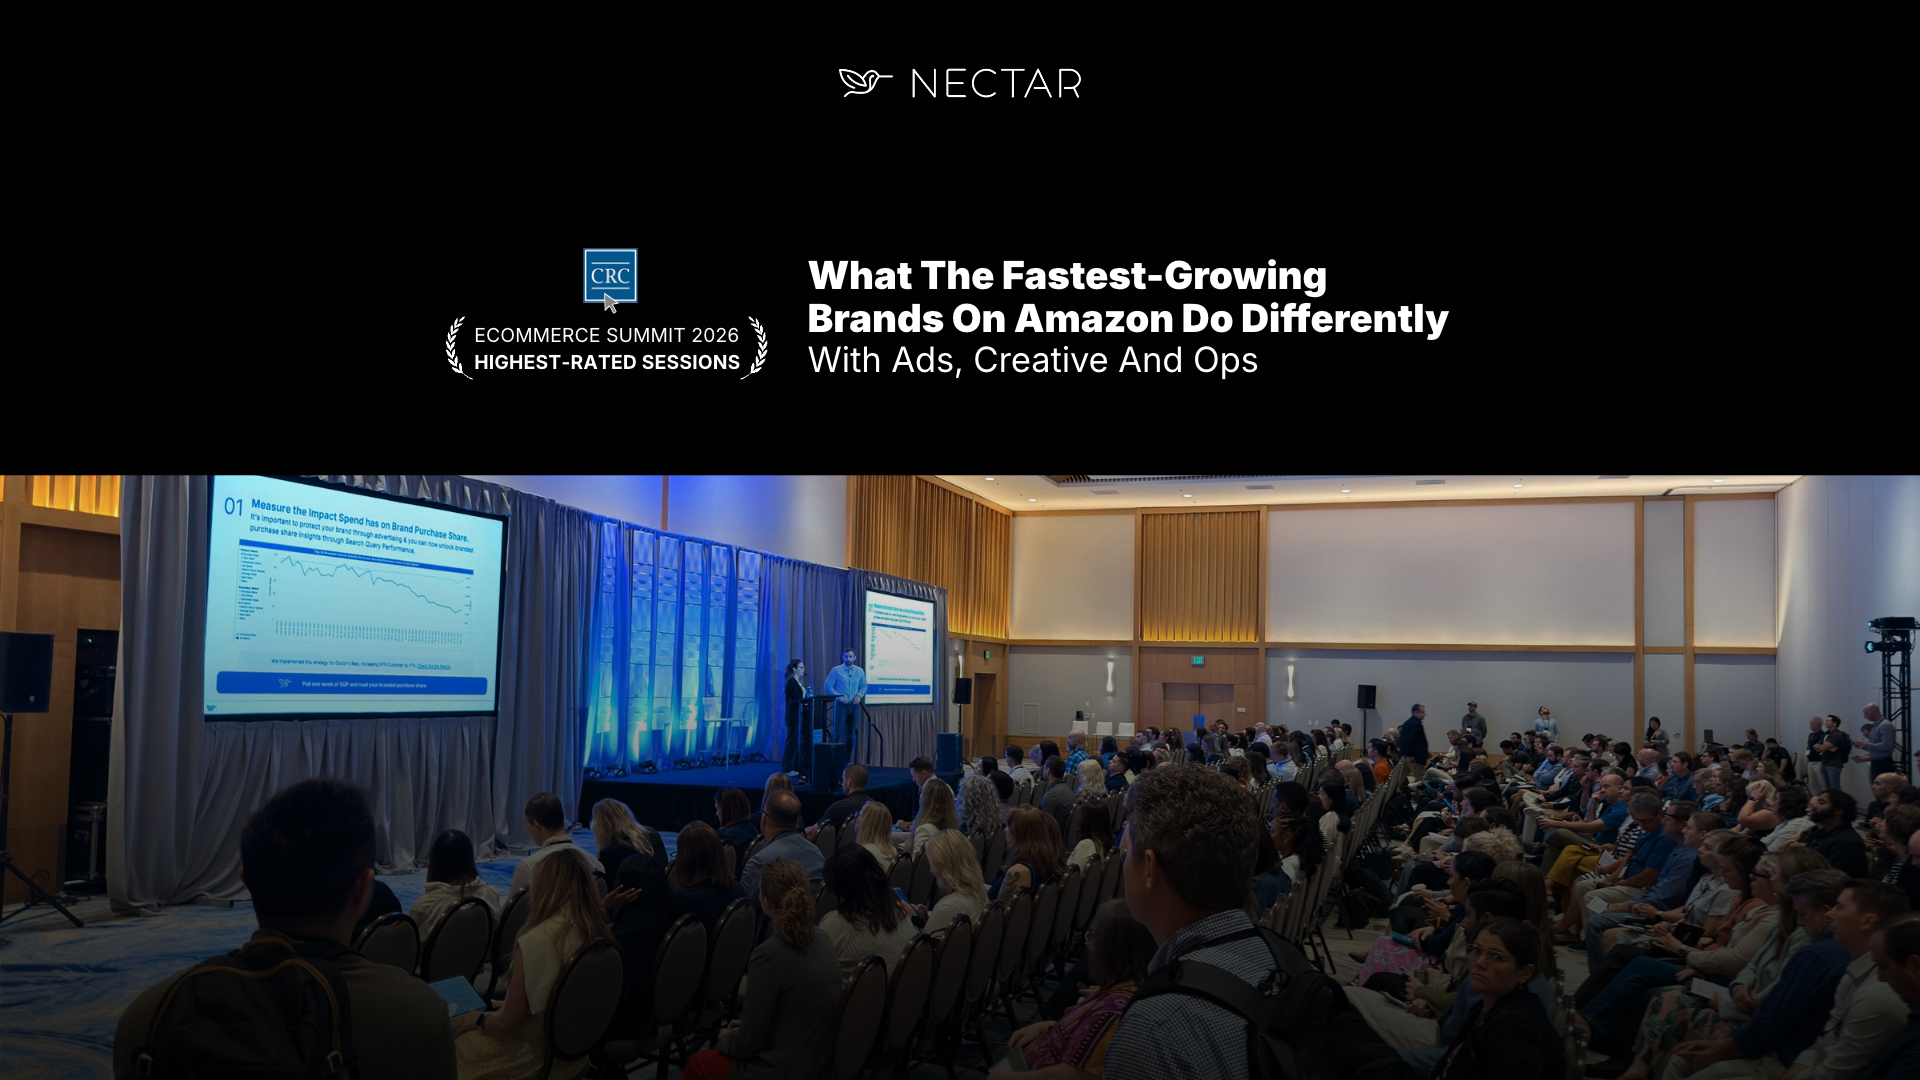
Nectar ran roughly 100 Amazon account audits over the past year, mostly Vendor Central brands spending anywhere from $500K to tens of millions a year on ads. The same issues showed up in more than 90% of them. This session first ran on the main stage at the CRC 2026 eCommerce Summit in San Diego, and Co-CEO Jason Landro and VP of Advertising Harriet Carson reran an extended version as a live webinar on October 28, 2026.
At Nectar, we manage Amazon programs for 120+ brands, with more than $250M in annual ad spend and $3B+ in marketplace sales. The fastest-growing Amazon brands in that portfolio share one habit: they work on measurement, retail operations and media at the same time instead of fixing one silo and moving on. Growth comes from moving several parts of the business forward together, not perfecting one.
Key Audit Stats (Nectar, 2025 to 2026):
- ~100: Amazon account audits Nectar completed over the past year
- 90%+: Share of those audited accounts showing the same core issues
- 20% to 60%: Typical share of ad spend going to search terms that have never produced an order, in accounts we audit
Measure Growth, Not ROAS
The first change the fastest-growing Amazon brands make is in how they define success.
ROAS Jail is Nectar's term for an account that optimizes toward return on ad spend so tightly that ad efficiency improves while the business stops growing. It is the most common pattern we find in audits.
Harriet walked through the classic version. Branded search terms reach shoppers who already know your brand, so they convert well and post a high ROAS (return on ad spend). Category terms reach shoppers who have never heard of you, so they convert lower. Optimize only to ROAS and budget drifts toward branded traffic, where you may be paying Amazon for purchases that would have happened anyway.
"The question I always ask is, if we weren't paying for that click, would we still have gotten the sale?"
Harriet Carson, VP of Advertising at Nectar
Ad Metrics vs. Business Metrics
Ad metrics tell you how the campaign did. Business metrics tell you whether the brand grew. Every metric in the right column can move the wrong way while ROAS improves.
| Question | Ad Metric (Campaign View) | Business Metric (Brand View) |
|---|---|---|
| Is spend efficient? | ROAS, ACoS (advertising cost of sales) | TACoS (total advertising cost of sales) |
| Are sales growing? | Ad-attributed sales | Total sales and organic sales |
| Are we adding customers? | Clicks and orders | NTB (new-to-brand) customers |
| Are we winning the category? | Impression share on ads | Purchase share and market share |
| Is it profitable? | Cost per order | Contribution margin |
SQP vs. AMC: The Two Tools That Measure Share
Search Query Performance tells you where you can gain share. Amazon Marketing Cloud tells you how your ads shaped the path to purchase. Both are free to use, and both are still underused in the accounts we audit.
Search Query Performance (SQP) is a Brand Analytics dashboard that shows, for each search term, your brand's share of impressions, clicks, cart adds and purchases, at both brand and ASIN level, according to Amazon's Seller Central announcement of the ASIN view. Because it combines paid and organic activity, it is the only place you see your share of a term rather than just your sales on it. Harriet recommends starting with the Simple view. The Comprehensive view adds noise before it adds answers.
Amazon Marketing Cloud (AMC) is Amazon's clean-room analytics environment for tracing which ad exposures preceded a purchase. A shopper might see a Prime Video ad, then a display ad, then search your brand a week later and buy through Sponsored Products. Last-touch reporting credits Sponsored Products. AMC shows the whole sequence. In January 2025, Amazon extended AMC's purchase lookback from 13 months to five years for measurement, per Amazon Ads. And as of June 2026, Amazon made its first-party paid feature signals in AMC free to query through December 31, 2026, as reported by PPC Land.
| Search Query Performance (SQP) | Amazon Marketing Cloud (AMC) | |
|---|---|---|
| Question it answers | Where can I gain share? | Which ads actually influenced the purchase? |
| Core data | Share of impressions, clicks, cart adds and purchases per search term | Ad exposures, paths to conversion, NTB, audience overlap |
| Granularity | Brand and ASIN, weekly, monthly or quarterly | Shopper-level signals, aggregated in queries |
| Where to find it | Brand Analytics > Search Query Performance | Your AMC instance, through templated reports or the Ads Agent |
| Main limitation | No ad spend in the report; you have to join it yourself | Historically needed SQL skills; templates and AI now lower that bar |
Vendor Central brands can get the full report too (see the FAQ below). The bigger catch is that SQP does not include ad spend. To see whether more spend is buying more share, you need to join spend to SQP at the search term level and trend it week over week. Our guide to using Amazon SQP to cut ad waste walks through that join, and our AMC incrementality analysis work covers the AMC side.
Want a read on your own account? Get an Amazon ads audit from Nectar.
Fix the Foundation Before You Buy More Traffic
Advertising buys attention. Retail readiness decides how much of that attention turns into sales.
Retail readiness is the condition of a product's detail page and supply (stock, Buy Box, price, content, reviews, titles and variations) that determines how much ad-driven traffic converts. Every dollar of media flows through the detail page, so a weak page limits what any ad can return.
"Advertising's gonna amplify the condition of the retail experience, it doesn't replace it."
Harriet Carson, VP of Advertising at Nectar
The Six Retail Readiness Levers
Your media plan assumes all six of these are healthy. When one slips, the ad account absorbs the cost.
| Lever | What Breaks | Effect on Ads |
|---|---|---|
| In stock and Buy Box | Stockouts, suppressed listings, lost Buy Box | Ads stop serving, and campaign learning resets |
| Competitive pricing | A price gap versus competitors | Lower conversion raises cost per sale on the same traffic |
| Images and A+ Content | Weak main image, thin below-the-fold content | Fewer clicks, and fewer of those clicks close |
| Reviews and ratings | Ratings slipping below the 4.5-star standard | ACoS climbs right away |
| Titles and indexation | Listing not indexed for a term | That keyword can't be bid on profitably |
| Variations and offers | Fragmented variations | Reviews and sales velocity split across weaker pages |
Harriet described the same budget producing two very different outcomes. On a product with weak content or stock issues, traffic arrives, conversion is low, the campaign looks inefficient and the team cuts spend before the keyword matures. On a product with strong fundamentals, the same spend converts, sales velocity lifts organic rank, and the efficiency frees budget for new keywords and audiences. In some audits, her recommendation is to move budget out of ads and into creative until the stock or Buy Box issues are fixed.
Build Content for Amazon, Not Your D2C Site
Most visitors to a brand's own site already know the brand. On Amazon, a shopper searching "hair dryer" is in the aisle comparing you against every other brand. That calls for more infographics and product detail than a minimal D2C page, and content that looks as premium as the price.
- Rewrite feature copy around what shoppers ask in reviews, not what the brand team wants to say.
- Make A+ Content and the Brand Store shoppable so high-traffic listings cross-sell and upsell.
- Treat the Brand Store as a merchandised storefront. As a Nectar benchmark, the Brand Store should account for at least 10% of an account's total revenue.
- Fix titles for mobile. Starting July 27, 2026, Amazon requires titles of 75 characters or fewer in every category except media, and will gradually replace longer titles with AI-recommended versions, according to Amazon's Seller Central announcement. You can check your listings with Title75, Nectar's free AI title tool.
In one hair dryer listing refresh shown in the session, Nectar's rewrite combined competitor research on 25+ products, review analysis and an impact-ranked list of the top 300 to 500 organic keywords. Conversion rate rose 4% across the optimized listings, and volume rose 12% within each parent.
Case in point: Olivia Garden. Nectar rebuilt Olivia Garden's product pages and Brand Store around how hair care shoppers actually choose tools, and average year-over-year sales per visitor rose 46%. Read the Olivia Garden case study.
The Vendor Central Gaps We Find Most Often
Most of these failures come from two teams that never compare reports: one owns inventory, the other owns advertising. Put inventory, Buy Box and ad spend on the same weekly report.
- Advertising ASINs with unconfirmed or short-shipped POs. Spend keeps pacing while the units never arrive.
- No days-of-cover threshold tied to ad pacing. Budget runs at full speed into a stockout instead of throttling ahead of it.
- Chargebacks nobody traces to a root cause. If products built for brick-and-mortar keep generating chargebacks online, that is a packaging and operations plan, not a one-off fix.
- Cost increases that never pass through. A cost increase request needs a business case built around Amazon's margin, including products designed to ship well through ecommerce.
- Suppressions and lost Buy Box nobody watches weekly. Conversion falls, ads look broken, and the campaigns were never the problem.
Make Every Ad Dollar Incremental
Once the foundation holds, the work shifts to whether each ad dollar is adding sales that would not have happened otherwise. Harriet covered five opportunities that show up in nearly every audit.
1. Test How Much Branded Spend Is Incremental
Run a controlled spend reduction on branded terms and watch your branded purchase share in SQP. If share holds while spend falls, that spend was not incremental. Brands should still protect branded traffic, especially when competitors bid on their name. The goal is the minimum effective spend.
- Baseline. Record weekly branded spend, branded purchase share, organic visibility on those terms and how aggressively competitors bid on your brand.
- Cut. Reduce branded spend by a set amount. Harriet usually starts around 15%. Brands with very high branded purchase share and little competitive pressure can test larger cuts.
- Re-read. Check branded purchase share the following week. If 99% moves to 98% on 15% less spend, most of that spend was capturing sales you would have made organically.
- Repeat. Keep cutting until purchase share starts to fall. That inflection point is your minimum effective branded spend.
- Come back. Check whether organic sales replaced the lost ad-attributed sales. Total sales and purchase share holding steady is the result that matters. This is the step most teams skip.
Then move the savings into category terms that reach shoppers who aren't looking for you yet. Cutting spend gives a cleaner read than increasing it, because increases get muddied by competitor moves. Revisit the test periodically, since the right level changes over time.
"...we're advocating for a methodology, it is not a precise science."
Jason Landro, Co-Founder and Co-CEO at Nectar
Pro tip: Put part of the branded savings into product targeting on your own detail pages. If you paid to bring a shopper to your page, don't lose them to a competitor's ad at the consideration step.
Case in point: Hamilton Beach. Most of its Sponsored Products budget sat on branded terms. Nectar shifted spend into category head terms, new-to-brand orders rose 83%, and "food processor" purchase share grew from 27.5% to 38.4%. Read the Hamilton Beach case study.
2. Cut Spend on Search Terms That Have Never Converted
Sort your search term report by spend, filter to zero orders and add it up. These are not underperforming terms. They are actual customer searches that generated clicks and not a single order in the period. In the accounts we audit, that bucket typically runs 20% to 60% of spend. Around 20% is within a normal range. Accounts Nectar manages run 5% to 8% with tight guardrails.
A starting rule from the session:
- 10 clicks, 30 to 60 days, no conversion: cut the bid by 50%. Add a spend threshold, such as $100, if you prefer.
- Two more weeks, still no orders: check AMC for shoppers who clicked and bought later through a longer lookback. If they didn't, pause or negate the term.
- Match type is the problem: negate the specific search term rather than pausing the whole keyword, so you keep the discovery traffic.
- Expensive or long-consideration products: raise the click threshold. Start from your account's average clicks per order.
This should run as an automated rule, not a manual task an ad manager remembers once a quarter. Our negative keyword templates are a good starting point. Sometimes a non-converting term points back to the detail page: the listing doesn't show that the product fits the search.
3. Graduate Proven Terms Out of Auto, Broad and Phrase
Auto, broad and phrase match are discovery tools. In most accounts we open, they are carrying the budget instead. A brand launches auto campaigns with a product, the product converts, and a year later the auto campaign still holds a large budget with no rule for moving proven terms into exact match.
Branded traffic also leaks through broad match. We've seen brands that believed branded ads were about 10% of spend find the real figure closer to 50% once they read the search term report. Campaign names won't tell you this.
| Exact Match Gives You | Without It |
|---|---|
| A bid you set for what the term is worth | You learn the price afterward from the search term report |
| Control over which ASIN and variation gets the traffic | Amazon decides where the traffic lands |
| Placement performance you can read and adjust | Placement data mixed across terms at campaign level |
Give every match type one job. Discovery campaigns discover. Proven terms graduate to exact match, where you can fund them deliberately and track them in SQP. See our breakdown of Sponsored Products match types for structure options.
4. Read Ad Spend Against Organic Sales
Chart ad spend, organic sales and TACoS together, at brand and product level. Then look at the last time you raised spend.
| Pattern | Ad Spend | Organic Sales | Total Sales | TACoS | What It Means |
|---|---|---|---|---|---|
| Incremental | Up | Up | Up | Stable or falling | Ads are building demand and organic rank |
| Saturating | Up | Flat | Up slightly | Rising | Diminishing returns on additional spend |
| Cannibalizing | Up | Flat or down | Flat | Rising | Paid sales are replacing organic sales |
These trends don't prove incrementality on their own, since other factors move sales too. They are a far better starting point than ROAS in isolation.
"I want ads to help build a business that becomes stronger organically over time."
Harriet Carson, VP of Advertising at Nectar
5. Fund Fewer ASINs, Harder
Organic rank is won by sales per keyword. Split the budget across 30 products and hundreds of keywords, and none of them sell enough to move. Five keywords on page one are worth more than 30 on page four.
- Pick the winners. Fund ASINs with strong conversion rate, solid reviews, reliable stock and real demand. If the page can't convert, more budget won't fix it.
- Fund a few keywords properly. Concentrate spend where it can change rank.
- Move the money. Once a keyword ranks on its own, drop paid to a maintenance bid and put the budget behind the next ASIN.
- Watch the halo. Read brand-level purchase share in SQP, check in AMC what else these buyers purchased, and track glance views on your other ASINs and Brand Store.
How to Run SQP at Scale
Reading SQP by hand works for a handful of ASINs, not a catalog. The data arrives in weekly, monthly and quarterly files with no ad spend, and only becomes useful once trended and joined to Sponsored Products, Sponsored Brands and Sponsored Display spend at the search term level.
Inside iDerive's advertising and incrementality analytics, Nectar groups related terms into cohorts (for example, "water bottle," "insulated water bottle" and "handheld water bottle"), then shows aggregate purchase share against aggregate spend for each cohort. Strong share on low spend signals room to invest. High spend with low conversion share signals a pullback. Our team also tracks organic rank for top terms next to the SQP and spend data.
Want this running on your catalog? Talk to our Amazon team.
Where to Start in the Next 30 Days
Each step below uses data you already have access to.
- Week 1: Pull one week of SQP in the Simple view and read your branded purchase share. Sort your search term report by spend, filter to zero orders and total it.
- Week 2: Set the 10-click, no-conversion bid rule. Cut branded spend 15% and record your baseline.
- Week 3: Re-read branded purchase share. Count what share of spend sits in auto and broad, and write a graduation rule.
- Week 4: Chart ad spend, organic sales and TACoS for your top products. Put inventory, Buy Box and ad spend on one weekly report.
Glossary
- ACoS (Advertising Cost of Sales): Ad spend divided by ad-attributed sales; the inverse of ROAS.
- AMC (Amazon Marketing Cloud): Amazon's clean-room analytics environment for analyzing ad exposures, paths to conversion and audiences.
- Buy Box: The "Add to Cart" placement on a detail page; ads generally stop serving when you lose it.
- NTB (New-to-Brand): A customer purchasing from your brand for the first time within the lookback period.
- Purchase share: Your brand's share of all purchases made after a specific search term, as reported in SQP.
- ROAS (Return on Ad Spend): Ad-attributed sales divided by ad spend.
- SQP (Search Query Performance): Brand Analytics dashboard showing brand and ASIN share of impressions, clicks, cart adds and purchases per search term.
- TACoS (Total Advertising Cost of Sales): Ad spend divided by total sales, paid and organic combined.
- Vendor Central (1P): The first-party model where brands sell wholesale to Amazon, versus Seller Central (3P), where brands sell directly to shoppers.
Frequently Asked Questions
Two of these came from the live Q&A. The rest are the questions we hear most often in audits.
What Do the Fastest-Growing Amazon Brands Do Differently?
The fastest-growing Amazon brands work on measurement, retail operations and media at the same time. They judge ads by business outcomes such as total sales, organic sales, TACoS, new-to-brand customers and purchase share instead of ROAS alone. They fix stock, Buy Box and content before buying more traffic, and they test whether each ad dollar is incremental, starting with branded search spend.
What Is ROAS Jail?
ROAS Jail is Nectar's term for an Amazon ad account optimized so tightly to return on ad spend that efficiency improves while the business stops growing. The usual cause is budget drifting toward branded search terms, which convert well because shoppers already chose the brand. ROAS rises, but new-to-brand customers, category purchase share and organic growth do not.
How Do I Know If My Branded Search Spend Is Incremental?
Run a spend reduction test. Record your branded purchase share in Search Query Performance, cut branded spend by about 15%, and check purchase share the following week. If share holds, for example moving from 99% to 98%, most of that spend was capturing sales you would have made organically. Keep cutting until share starts to fall, then move the savings into category terms.
Does Cutting Branded Spend Hurt Relevancy or Organic Rank?
An attendee asked this live, after pushback from an internal media team. Harriet's answer: your own brand terms usually carry very high organic relevancy, which is also why ranking organically on competitor brand terms is so hard. Track organic share of voice, impressions and clicks on those terms during the test. If they don't change, the spend was not incremental. Reinvesting the savings in category terms raises overall visibility.
Can SQP Measure Incremental Versus Cannibalized Sales?
Not directly. SQP reports total purchases per search term without splitting paid and organic, though you can combine it with paid purchases and average selling price to estimate organic lift. The cleanest read on cannibalization comes from spend reduction tests. Jason recommends grouping related terms into cohorts and comparing aggregate purchase share against aggregate spend, and treating the result as a strong proxy, not a precise measurement.
What Is the Difference Between SQP and AMC?
Search Query Performance shows your brand's share of impressions, clicks, cart adds and purchases for each search term, so it answers where you can gain share. Amazon Marketing Cloud shows the ad exposures that came before a purchase, so it answers which ads actually influenced the sale. SQP lives in Brand Analytics. AMC runs in its own instance, now with templated reports and AI-assisted queries. See the full comparison table above.
Can Vendor Central Brands Access Search Query Performance?
Yes, with a gap. As of October 2026, Vendor Central brands get a limited SQP view that shows total purchases per search term but not purchase share. To get the full report, vendors can assign brand registry to a Seller Central account. You don't need to activate any offers on that account. Nectar uses this approach for its Vendor Central partners.
Where Should I Start?
Start with two reports you already have. Pull one week of Search Query Performance and read your branded purchase share, then sort your search term report by spend and total everything with zero orders. Those two numbers usually show where the fastest savings are. The 30-day plan above sequences the rest.
Build an Amazon Business That Grows Organically
The fastest-growing Amazon brands don't win by spending more. They measure business outcomes, fix the detail page before buying traffic, and test where every ad dollar goes. Part two of this session, covering full-funnel and creative, is coming. If you want a second set of eyes on your account before then, our team runs these audits every week.
About the Nectar Team
Nectar is a marketplace agency built by Amazon operators, managing 120+ brands, more than $250M in annual ad spend and $3B+ in marketplace sales. Our channel managers, ad buyers, strategists, data analysts and in-house creative studio work together to grow every part of our partners' ecommerce businesses, supported by our analytics platform, iDerive.
Related Reading
- AMC Levers That Actually Drive Revenue: The AMC analyses worth building your ad strategy around.
- Attribution Tells You What Got Credit. Incrementality Proves What Worked.: Why attributed ROAS overstates what your ads actually add.
- Retail Media vs. Brand Media: How to Untangle the Budget Fight in 2026: Our previous webinar recap on allocating budgets by objective.
- How Hamilton Beach Grew New-to-Brand Orders by 83%: Moving budget from branded terms into category search.