Inventory forecasting on Amazon means predicting future unit sales per SKU and converting that number into a reorder point, the exact quantity that triggers your next purchase order. The fastest version of the math: daily velocity × lead time in days + safety stock = reorder point. Get that number wrong and you either pay storage fees on dead stock or lose the Buy Box to a stockout.
Three places to anchor your process before you build anything else:
- Seller Central’s demand forecast, which projects unit demand for your catalog.
- Your Inventory Performance Index (IPI), which gates storage capacity and signals restock urgency.
- A dedicated analytics layer for sellers whose SKU count has outgrown spreadsheet math.
Everything below builds out that formula into a system you can run every week.
TL;DR:
- Accurate lead time measurement from actual past purchase orders, typically 60 to 90 days for overseas sourcing, is critical for correct reorder point calculation.
- 30 to 45 days of safety stock is now recommended for most FBA SKUs to buffer against tighter fees and stockout risks in 2026.
- Weekly reviews of velocity, IPI scores, and open POs are more effective than daily checks for maintaining optimal inventory levels.
- Small catalogs under 30 SKUs can rely on spreadsheets; larger or multi-channel operations benefit from dedicated forecasting platforms or managed services.
- Consistent weekly discipline, especially updating lead times and recalculating safety stock, is the key to preventing forecast errors and stockouts.
What Data Does Amazon Inventory Forecasting Actually Require?
Forecast accuracy starts with velocity. Most sellers track a trailing 30-day average for fast-moving SKUs and a weighted 90-day average for anything seasonal or promo-sensitive, since a single spike week can distort a 30-day window badly. Weight recent weeks more heavily if you’re mid-launch; weight further back if a competitor stockout temporarily inflated your numbers.
Lead time is where most forecasts quietly fail. It isn’t your supplier’s quoted production time. It’s production plus freight plus customs clearance plus FBA receiving, measured from your last three to five actual purchase orders, not a vendor’s promise. Sellers sourcing overseas often see 60 to 90 days from PO placement to sellable inventory once every stage is accounted for honestly.
Here’s the core math:
- Reorder point = (average daily velocity × lead time in days) + safety stock
- Safety stock = Z-score × standard deviation of demand × square root of lead time
- Days of cover = current inventory ÷ average daily velocity
Statistic to know: Operator guides now recommend 30 to 45 days of safety stock for many FBA SKUs, up from looser buffers sellers used before Amazon’s recent fee restructuring tightened the cost of both stockouts and excess storage.
The three errors that break most forecasts: ignoring lead-time variance (treating a range as a fixed number), letting a promotional spike leak into your baseline velocity, and forecasting at the parent ASIN level instead of per FNSKU, which hides which specific variant is actually running out.
Which Amazon Tools Show You Real Inventory Signals?
Seller Central isn’t a black box here, but it also isn’t the whole answer. The demand forecast tool estimates future demand weeks ahead, which is useful for directional planning but too coarse for weekly reorder decisions on individual SKUs.
For day-to-day operations, three signals matter more:
- IPI score determines your storage capacity limits and flags when Amazon thinks you’re overstocked or understocked.
- Inventory age reports show how much stock is sitting past 90, 180, or 365 days, which predicts aged-inventory surcharges before they hit your P&L.
- Restock recommendations and the FBA Restock tool suggest reorder quantities based on Amazon’s own model, pulled from its broader inventory management toolkit.
These native tools work fine if you sell on Amazon alone with a modest catalog. They fall short for multi-channel sellers who need inventory visibility across Walmart or Shopify simultaneously, and they don’t give you clean per-FNSKU granularity when you’re running the same product in six sizes and three colors.
Pro Tip: Pull your IPI history monthly and chart it against your safety-stock days. A declining IPI almost always precedes a storage-capacity cut, so you’ll see the squeeze coming weeks before Amazon enforces it.
How Do You Calculate a Reorder Point Step by Step?
Here’s the full math with real numbers, ready to drop into a spreadsheet.
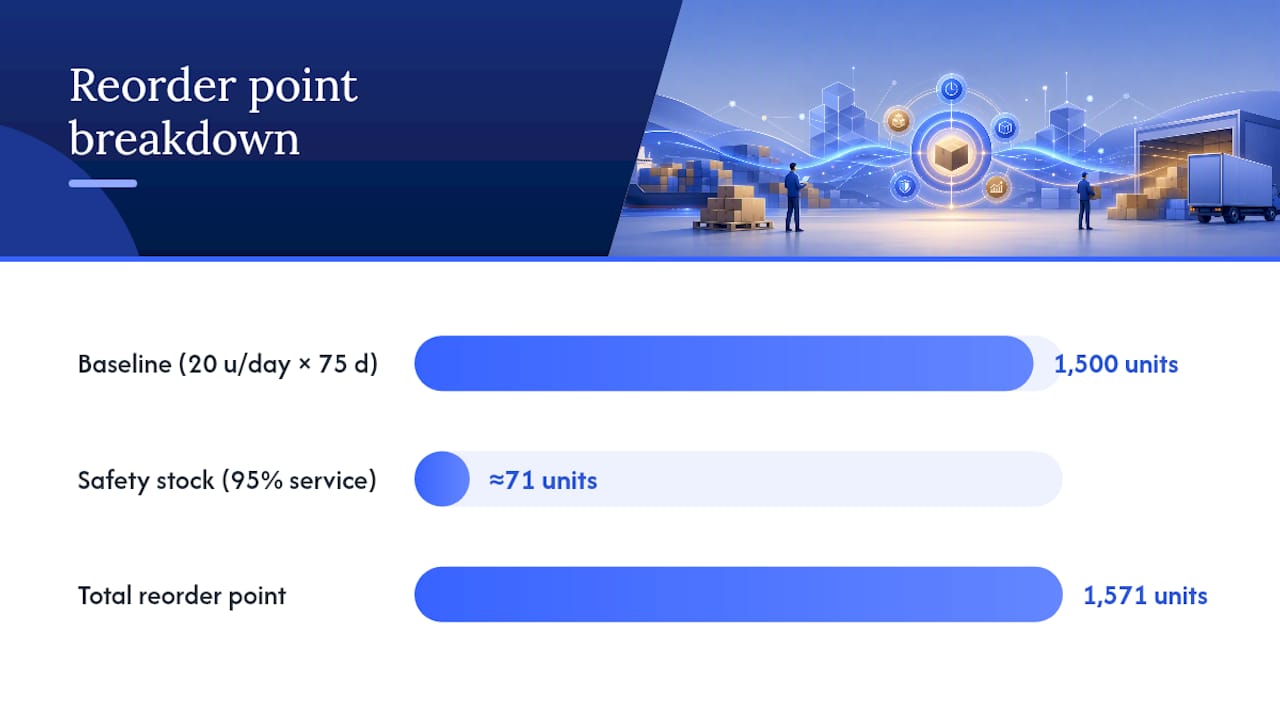
Example 1: standard reorder point. A SKU sells 20 units a day (90-day weighted average). Verified lead time from your last four POs is 75 days. Reorder point = 20 × 75 = 1,500 units before adding safety stock.
Example 2: safety stock with a service-level target. Demand standard deviation is 5 units/day, lead time is 75 days. Safety stock = 1.65 × 5 × √75 ≈ 71 units. Add that to your 1,500-unit base and your true reorder point lands near 1,571 units.
- Multiply daily velocity by lead-time days for your baseline.
- Apply the Z-score formula for safety stock, choosing 1.65 for 95% service or 2.33 for 99% on your highest-risk SKUs.
- Add the two figures together for your final reorder point.
- Divide current inventory by daily velocity to get days of supply, and compare that against Amazon’s low-inventory-level thresholds.
Reserve the higher target for SKUs where a stockout costs you rank, not your whole catalog.
What Does a 30-Day Amazon Inventory Planning Setup Look Like?
Building projected inventory levels you can actually trust takes about a month, done in weekly stages rather than all at once.
- Week 1: Export 90 days of sales history and your last five completed POs. Calculate true lead time per SKU from PO-placed to sellable date, not from supplier quotes.
- Week 2: Compute reorder points and safety stock for every SKU, then segment your catalog into A/B/C tiers by revenue contribution so your top sellers get closer attention.
- Week 3: Place your first forecast-driven PO using the new reorder-point math, and decide which portion ships to FBA directly versus routing through AWD or a third-party warehouse as a buffer.
- Week 4: Reconcile what actually arrived against what you ordered, adjust your lead-time assumption if it drifted, and lock in your recurring weekly review.
Once live, a Monday-morning cadence works for most catalogs: refresh velocity numbers, triage A-tier SKUs for reorder urgency, check IPI and stranded inventory, and reconcile open POs against expected arrival dates. Forum discussions among active FBA sellers consistently point to this weekly rhythm as the sweet spot. Daily checks generate noise without adding useful signal.
Pro Tip: For Q4 or any major promotional event, start pre-positioning inventory 10 to 12 weeks out, not four. FBA receiving slows dramatically in the six weeks before Prime Day and the winter holidays, and that delay eats directly into your lead-time buffer.
Spreadsheets, Software, or a Managed Partner: Which Fits Your Catalog?
The right tool depends almost entirely on SKU count and channel complexity, not personal preference.
- Under 30 SKUs: A well-built spreadsheet with the formulas above is genuinely enough. Don’t overbuy software for a catalog this size.
- 30 to 150 SKUs: Lightweight forecasting software earns its cost here, mainly for automated lead-time tracking and basic seasonality detection.
- 150+ SKUs or multi-channel selling: A dedicated platform or managed service becomes worth the spend, particularly once you’re reconciling inventory across Amazon, Walmart, and Shopify at the same time.
Whatever you choose, prioritize four capabilities: automated lead-time calculation from PO history, seasonality detection that doesn’t require manual override every quarter, per-FNSKU support instead of parent-level rollups, and visibility into AWD and inbound shipment status. If you’re evaluating whether to bring in a managed partner, start by gathering your full SKU list, 90 days of sales history, documented lead-time history, and current inbound shipment status. Any competent forecasting-driven agency will ask for exactly that.
How Nectar Approaches Amazon Inventory Forecasting
Nectar runs as a fully managed e-commerce agency for mid-market and enterprise brands selling across Amazon, Walmart, and Shopify, not a software subscription you configure yourself.
- Forecasting and retail-readiness work sits inside a dedicated operations capability, paired with in-house creative production for listings and brand stores.
- The proprietary iDerive analytics platform unifies reporting across marketplaces rather than forcing separate dashboards per channel.
- Forecasting connects directly to advertising and catalog decisions, rather than living in an isolated spreadsheet nobody else on the team sees.
Brands with complex SKU counts, multi-channel exposure, or high Q4 stakes tend to outgrow manual forecasting fastest. Before reaching out to any agency, gather your SKU list, trailing 90-day sales, documented lead-time history, and current inbound shipment status.
Here’s your immediate takeaway in table form:
| Point | Details |
|---|---|
| Core formula | Reorder point equals daily velocity times lead time, plus safety stock. |
| Lead time | Calculate from actual past POs, not supplier quotes, since real lead time often runs 60 to 90 days. |
| Safety stock target | Many FBA sellers now hold 30 to 45 days of buffer given tighter 2026 fee dynamics. |
| Cadence | A weekly Monday review of velocity, IPI, and open POs beats daily checking for most catalogs. |
| Nectar’s role | Nectar pairs forecasting and retail-readiness work with its iDerive analytics platform for brands outgrowing spreadsheets. |
How Should You Adjust Forecasts for Sales Velocity and Returns?
A forecast built once and never touched again is already wrong by the time you use it. Sales velocity shifts week to week, and return rates quietly distort your “sold” numbers if you’re not correcting for them.
Recalculate velocity on a rolling basis rather than treating your original 90-day average as fixed. The opposite applies too: a steady decline over three weeks should shrink your next PO quantity before you’re sitting on excess stock.
Return rates matter more than most sellers admit. Net your velocity calculation against average return rate per SKU, not per category, since return behavior varies wildly even within a single product line.
Segmenting by A/B/C tier again helps here. Your top revenue SKUs deserve weekly velocity recalculation. Lower-tier SKUs can run on a monthly review without meaningfully hurting your forecast accuracy, which frees up time for the adjustments that actually move revenue.
How Does External Market Data Improve Forecast Accuracy?
Your own sales history tells you what happened. It doesn’t tell you what’s about to happen because of a competitor’s stockout, a category-wide price shift, or a seasonal trend building outside your own data.
Competitor stock status is one of the simplest signals to watch manually: if a top competing ASIN goes out of stock, expect a temporary velocity spike on your own listing, and don’t mistake it for permanent demand growth once they restock. Category-level search trend data, even eyeballed through Amazon’s own search term reports, flags rising or falling interest before it shows up in your sales numbers.
If you’re building anything resembling a formal forecasting model rather than a spreadsheet, the input structure matters. Amazon Forecast’s inventory-planning dataset requires item ID, timestamp, and demand fields at minimum, and any external data source you fold in, like pricing shifts or promotional calendars, needs to map cleanly to that same structure to actually improve model output. For sellers building more sophisticated systems, AWS’s reference architecture guidance covers how to ingest that kind of multi-source time-series data without breaking your pipeline.
You don’t need enterprise infrastructure to benefit from this thinking. Even a simple monthly note comparing your velocity trend against a competitor’s stock status and any known seasonal event adds real context that pure historical averages miss.
What Are the Biggest Amazon Inventory Forecasting Challenges?
Three problems show up in nearly every seller’s forecasting process, regardless of catalog size.

Lead-time uncertainty tops the list. Suppliers quote optimistic numbers, freight delays happen, and customs clearance varies by season. The fix isn’t a better guess, it’s tracking your actual historical lead time per supplier and building variance into your safety stock rather than assuming a fixed number.
Promotional and seasonal demand spikes are the second recurring failure point. A Prime Day spike or a holiday promotion inflates your trailing velocity average for weeks afterward if you don’t manually exclude that window from your baseline calculation. Sellers who fail to correct for this consistently over-order in the following month.
Multi-channel visibility is the third challenge, and it’s growing as more brands sell across Amazon, Walmart, and Shopify simultaneously. Amazon’s native forecasting tools have no awareness of your Walmart inventory commitments or your Shopify fulfillment obligations, which means a seller relying solely on Seller Central’s numbers is forecasting blind to a meaningful share of their actual demand.
The common thread across all three: each one gets easier to manage with a documented process and a consistent weekly review, not with a more complicated formula.
The Real Bottleneck Isn’t the Formula, It’s the Discipline
The reorder-point math in this guide isn’t complicated, and that’s exactly the point most sellers miss. Every formula here fits in a single spreadsheet row. What actually separates sellers who avoid stockouts from sellers who don’t is whether they run the calculation every week or only when a shortage already hurts.
Conventional advice treats forecasting as a one-time setup: build the spreadsheet, plug in the numbers, move on. That’s backward. Lead times drift, return rates shift by season, and a single viral TikTok mention can blow up your velocity baseline overnight. A forecast that isn’t revisited weekly is a forecast that’s already stale.
If there’s one place sellers should prioritize first, it’s lead-time accuracy over anything else. A perfect safety-stock formula built on a wrong lead-time assumption still produces a bad reorder point. Pull your actual PO history before you touch a single formula.
The bigger shift for 2026 isn’t the math changing, it’s the margin for error shrinking. Tighter storage fees and stricter low-inventory penalties mean the sellers who treat forecasting as a spreadsheet chore, rather than a weekly discipline, are the ones who’ll feel it first.
— Dan Katona
Where Nectar Fits Once Forecasting Outgrows Your Spreadsheet
Spreadsheets and lightweight software handle forecasting fine until your catalog, channel count, or Q4 stakes outpace what one person can track manually. That’s the point where Nectar becomes the practical next step, not a replacement for the math in this guide, but the team and infrastructure to run it at scale across Amazon, Walmart, and Shopify at once.

Nectar pairs forecasting and retail-readiness work with its iDerive analytics platform, so reorder points, IPI trends, and inbound shipment status live in one place instead of scattered across separate dashboards and spreadsheets. That unified view matters most for brands managing hundreds of SKUs or juggling inventory commitments across multiple marketplaces simultaneously, where a missed signal on one channel quietly drains capacity on another.
If your forecasting process has outgrown manual tracking, start by exploring Nectar’s Amazon growth and optimization services to see how a managed team handles the full inventory and demand-planning cycle alongside advertising and catalog strategy.
Sources
- Demand forecast
- Sell
- INVENTORY_PLANNING Domain - Amazon Forecast
- Amazon Inventory Forecasting: 2026 Guide for FBA Sellers
- Reference guide to build inventory management and forecasting solutions on AWS
Recommended
- Nectar Blog | Mastering Amazon FBA Inventory Management: Practical Tips to Avoid Common Pitfalls
- Nectar Blog | Setting Goals Isn’t Enough: 5 Steps for Creating a Roadmap to Sell on Amazon
- Nectar Blog | Optimizing Your Amazon Listing: Drive Profits With These 5 Strategies
- Forecasting & Retail Readiness | Inventory Planning & Analytics


























































.webp)